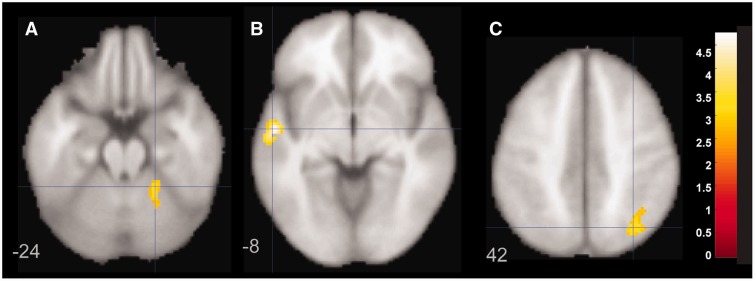
Figure 4.
Figure demonstrating statistically greater activation in left superior temporal gyrus (B) and right superior parietal lobule (A) and cerebellum (C) for the bipolar disorder and MDD groups relative to the healthy control group. Panels are labelled at different z coordinates and MDD/BD greater than healthy controls.

