
Figure 2. Low expression of GLUT3 in HD mice and HD cells.
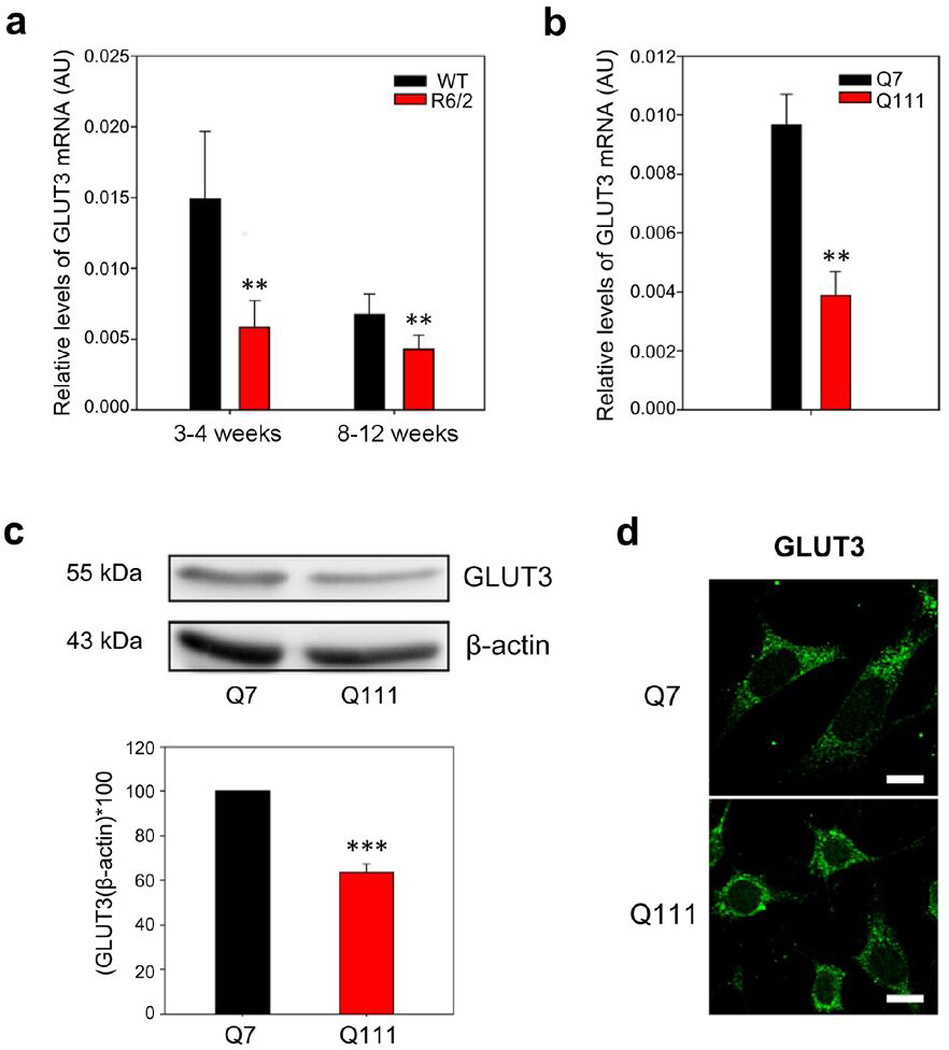
(a) qPCR analyses for GLUT3 from mRNA extracts of striatum from presymptomatic (3–4 weeks old) and symptomatic (8–12 weeks old) R6/2 mice. Striatum samples from littermates (WT) were used as controls. Results were normalised using specific primers to amplify mRNAs coding for β-actin. Analysis of variance (ANOVA) followed by the Bonferroni post-test,, n=4, ** p<0.01 and * p<0.05. (b) qPCR analyses for mRNA coding for GLUT3 in Q7 and Q111 cells. Student’s t-test, n=4, ** p<0.01. (c) Western blot assay for GLUT3 of total protein extracts from Q7 and Q111 cells. Bar plots show quantification of GLUT3 Western blot by densitometric scanning analysis, n=3, *** p<0.001, ** p<0.01. (d) Immunofluorescence analyses for GLUT3 (green) in Q7 and Q111 cells. Representative images for four independent experiments. Scale bar is 10 µm.