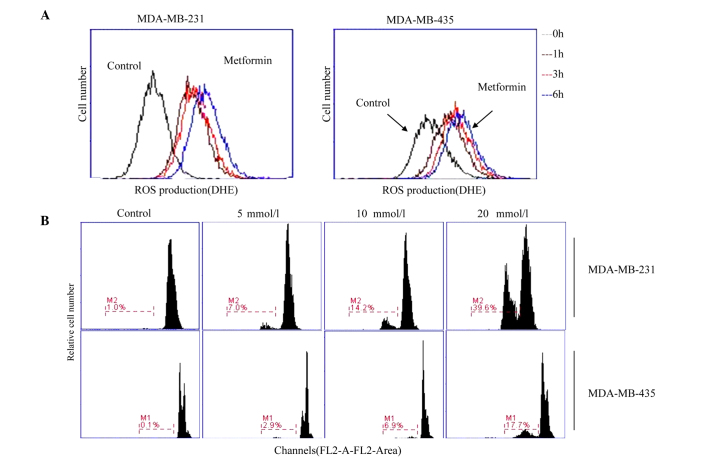
Figure 3.
ROS production and apoptosis in MDA-MB-231 and MDA-MB-435 cells treated with metformin. (A) ROS were measured in MDA-MB-231 and MDA-MB-435 cells treated with metformin (20 mmol/l) for 1, 3 and 6 h. Cells were loaded with DHE (5 mmol/l) and viewed using fluorescence microscopy. In the graph, cell number is presented on the y-axis and fluorescence intensity on the x-axis. The fluorescence intensity gradually increased over time, suggesting significant generation of intracellular ROS in metformin-treated cells compared with untreated control cells. (B) MDA-MB-231 and MDA-MB-435 cells were cultured with various concentrations of metformin (0, 5, 10 and 20 mmol/l) for 24 h, then loaded with propidium iodide before flow cytometric analysis to assess apoptosis. ROS, reactive oxygen species; DHE, dihydroethidium.

