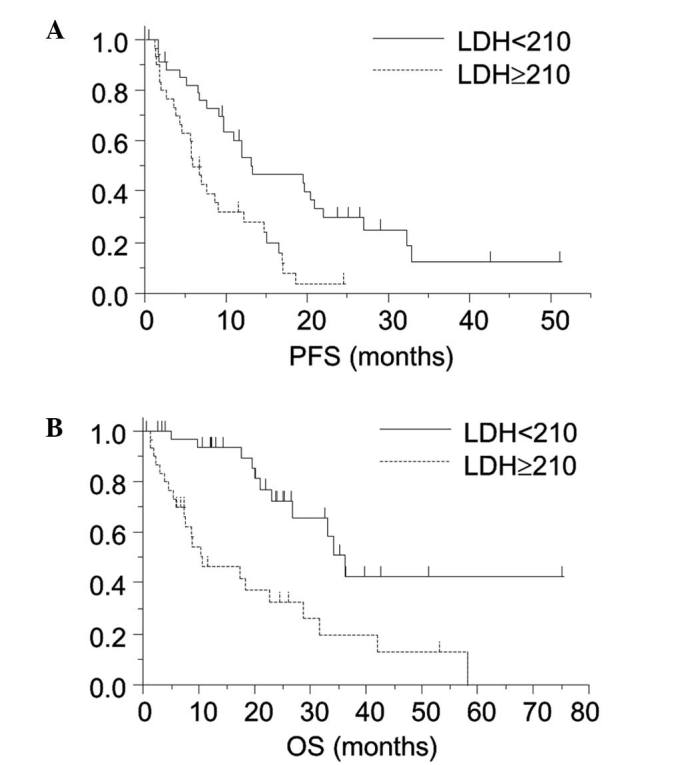
Figure 1.

Kaplan-Meier curve for each patient group divided according to the plasma LDH level (solid line, LDH <210; dashed line, LDH ≥210). The patient group with a higher plasma LDH level had (A) shorter PFS (P<0.01) and (B) OS (P<0.01) periods. LDH, lactate dehydrogenase; PFS, progression-free survival; OS, overall survival.
