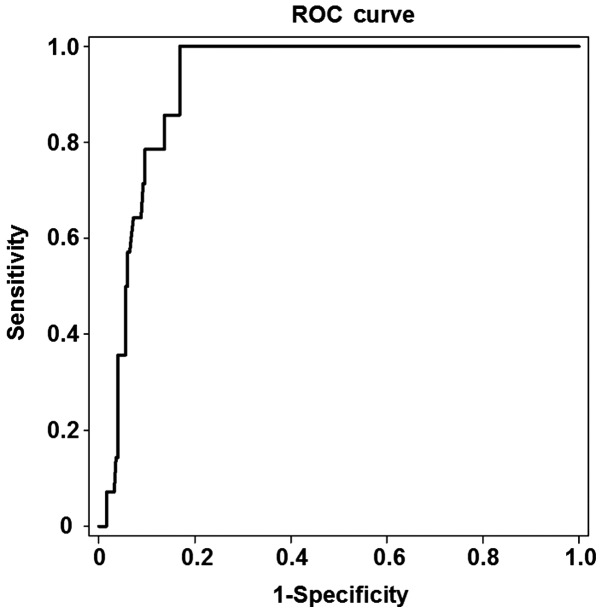
Figure 3.
ROC curve for the analysis of liver stiffness measurement values, which were measured by Fibroscan, in the patients with stage S3 liver fibrosis. The area under ROC curve for the prediction of the development of liver fibrosis was 0.923, and the optimal cut-off value was 10.95 kPa in the patients with stage S3 liver fibrosis. The threshold of the optimal cut-off value had a sensitivity of 78.6% and a specificity of 90.4%. ROC, receiver operating characteristic.

