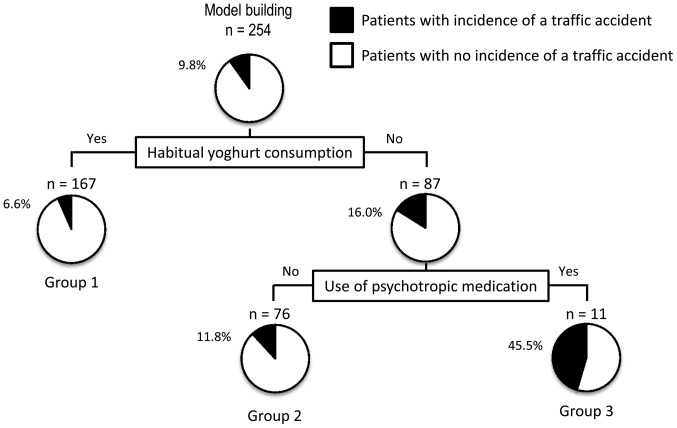
Figure 3.
A decision-tree algorithm for the incidence of traffic accidents. The subjects were classified according to the indicated variables. The pie graphs indicate the proportion of patients with no incidence of a traffic accident (white) and those with an incidence of a traffic accident (black) in each group.

