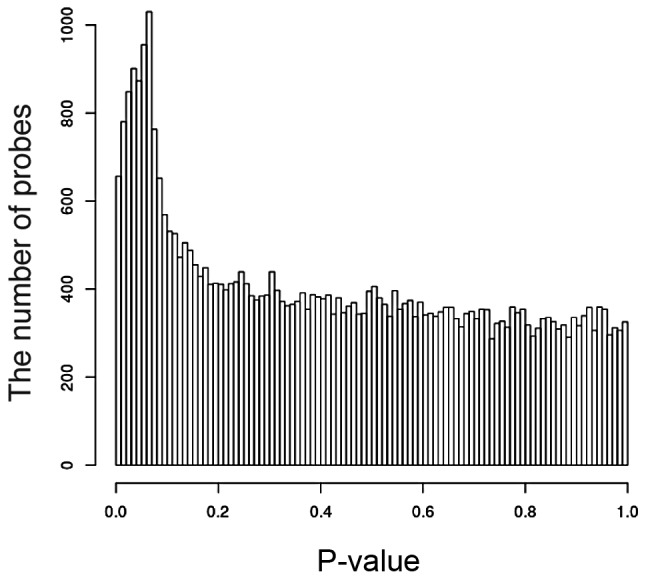
Figure 1.

Distribution of P-values. The x-axis represents the P-value. The height of each bin is the number of probes that fall into an interval. If there was no differential expression observed, all the bars would be of approximately the same height.
