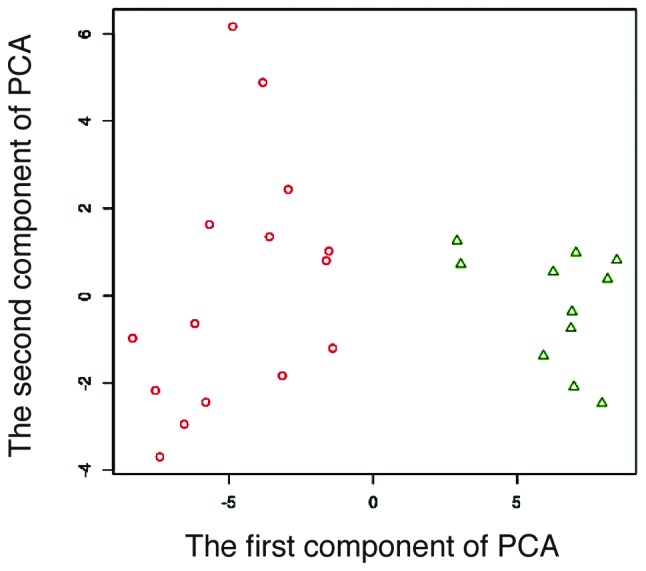
Figure 3.

Processing results of the existing datasets of the 26 subjects. Red circles, non-responders (grade 0/1a/1b). Green triangles, responders (grade 2 or 3). When an 80-gene set was selected, the 26 patients were divided into two distinct groups in the two-dimensional graph.
