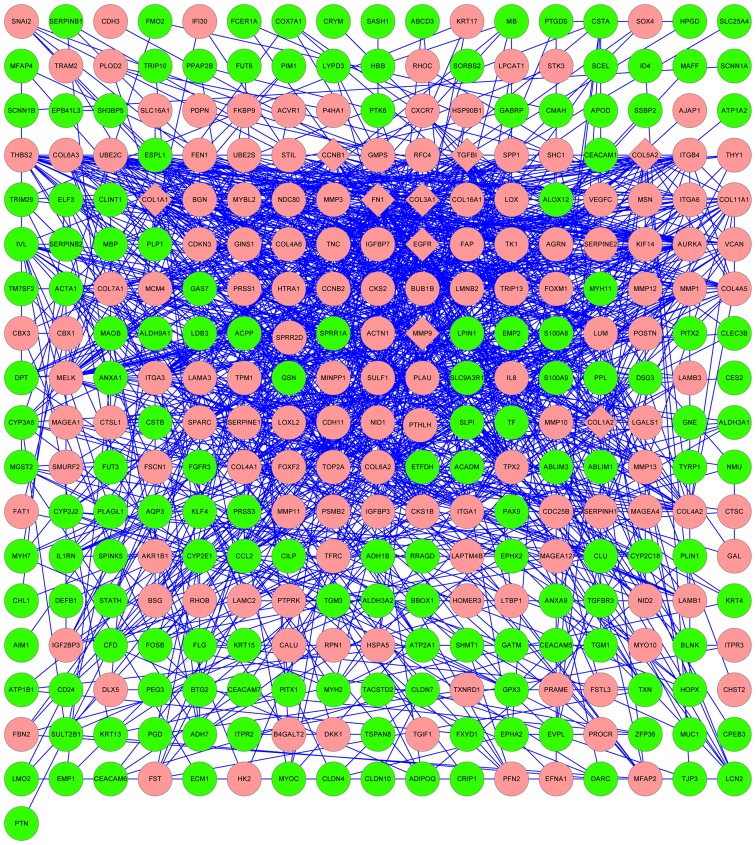
Figure 2.
Protein-protein interaction network for differentially expressed genes. Red nodes correspond to upregulated genes in HNSCC, while green nodes correspond to downregulated genes in HNSCC. Diamonds represent hub nodes (nodes with a degree of connectivity ≥30). HNSCC, head and neck squamous cell carcinoma.

