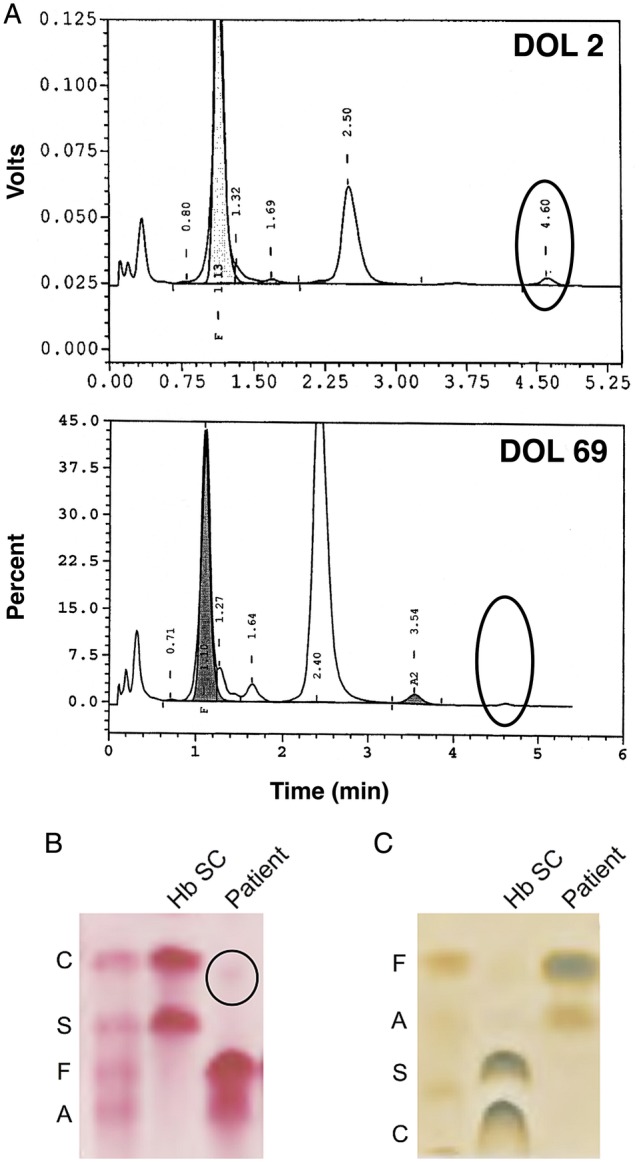
Figure 2.

High-performance liquid chromatography (HPLC) analysis and haemoglobin electrophoresis identifing a putative haemoglobin variant. (A) HPLC retention plots showing day of life (DOL) 2 (top) and DOL 69 (bottom). An unidentified peak, representing 1.9% of total haemoglobin on DOL 2 but undetectable on DOL 69, is indicated. (B) A gel from cellulose acetate haemoglobin electrophoresis showing a sample corresponding to DOL 2. A faint band identified in the patient's sample is indicated. (C) A gel from citrate agar electrophoresis showing a sample corresponding to DOL 2.
