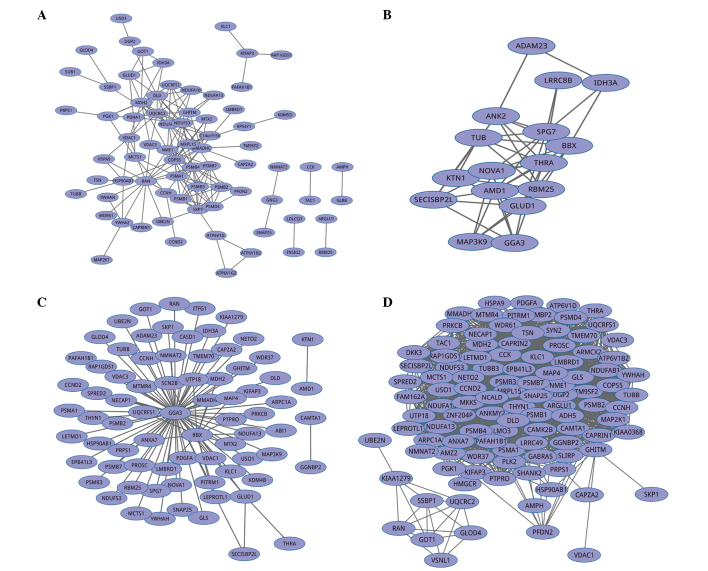
Figure 1.
Graphical representation of co-expression networks identified by four existing method. Genes are denoted as nodes and interactions between gene pairs are presented as edges. (A) Search tool for the retrieval of interacting genes/proteins database, (B) differentially co-expressed genes and links, (C) empirical Bayesian and (D) weighted gene co-expression network analysis.

