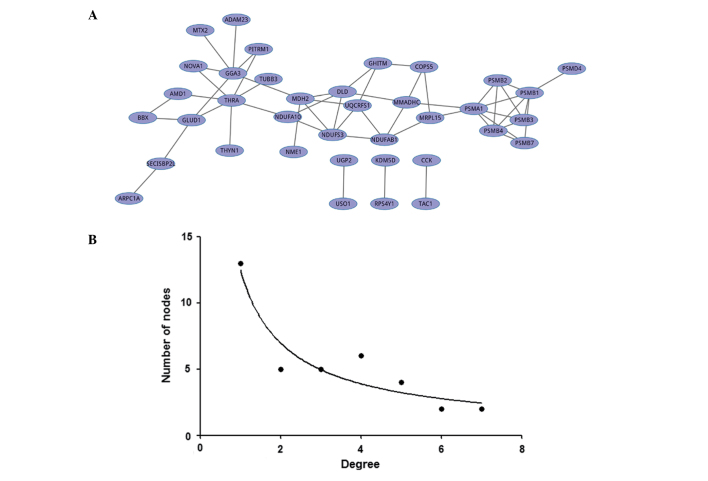
Figure 2.
Combined co-expression network using the novel algorithm and its degree distribution. (A) Combined co-expression network based on the novel scores of each gene pair across four methods. A total of 37 nodes and 57 edges composed this combined network. (B) Scatter-gram of gene degree in this co-expression network. The combined co-expression network was a scale-free network whose degree distribution followed a power law (y=axb, where a=12.464, b=−0.840, R2=0.881).

