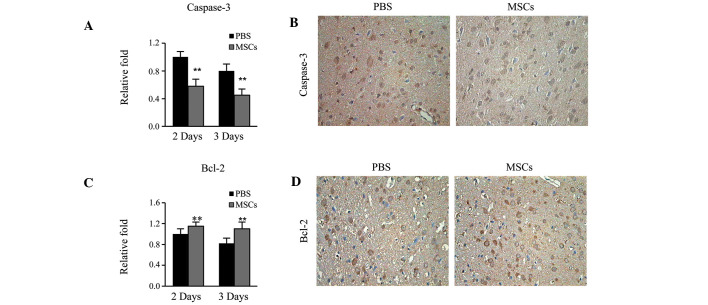
Figure 4.
Evaluation of Caspase-3 and Bcl-2 expression levels in ischemic rat brains. (A) Relative mRNA expression levels of Caspase 3 on days 2 and 3 after the establishment of middle cerebral artery occlusion (MCAO) in the PBS and MSCs groups. Data are presented as the mean ± standard deviation (SD). *P<0.05 vs. PBS group. (B) Immunohistochemical staining of Caspase-3 on day 3 following the establishment of MCAO in PBS and MSCs groups (magnification, ×200). (C) Relative mRNA expression levels of Bcl-2 on days 2 and 3 following the establishment of MCAO in PBS and MSCs group. Data are presented as the mean ± standard deviation. **P<0.01 vs. PBS group. (D) Immunohistochemical staining of Bcl-2 on day 3 after MCAO in PBS and MSCs group (magnification, ×200). n=10 in each group at each time point. PBS, phosphate-buffered saline; MSCs, mesenchymal stem cells; Bcl-2, B-cell lymphoma 2.

