
Fig. 2.
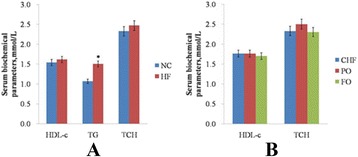
Serum biochemical parameters. (a) Serum biochemical parameters of obesity-insulin resistance rats. (b), Serum biochemical parameters of the rats after the intervention. Data are mean ± standard deviation (SD), n = 12 Rats per diet. “*” (p < 0.05) means it is significantly different with the NC or CHF group