Fig. 4.

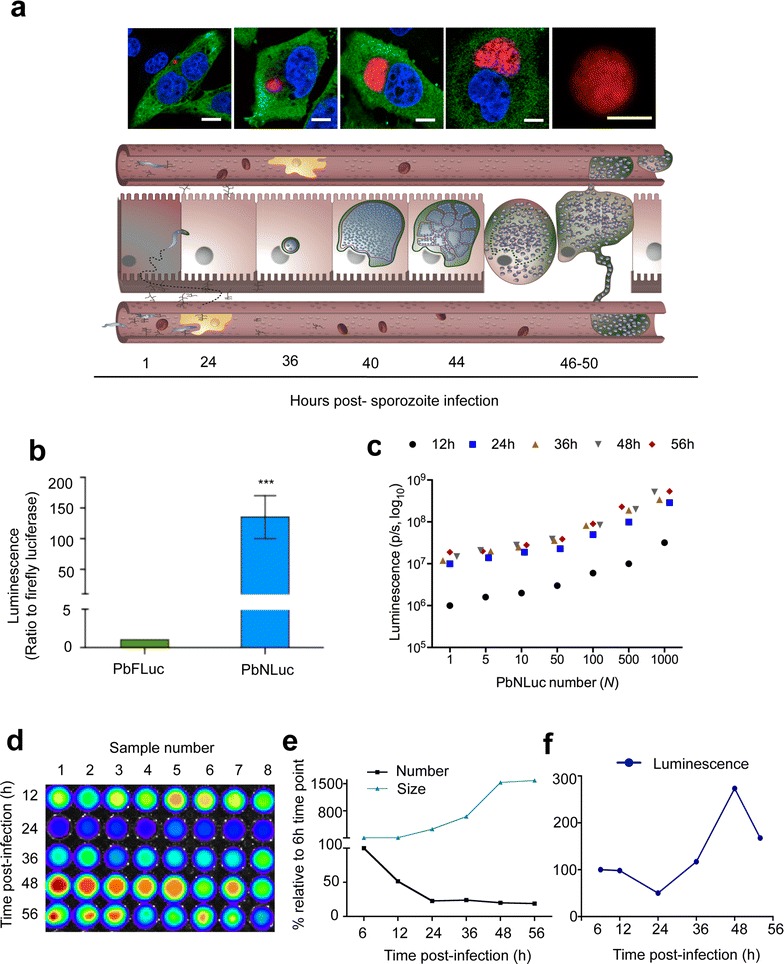
Bioluminescence imaging of P. berghei pre-erythrocytic stages. a Fluoresence images of liver cells infected with PbNLuc, showing parasite development from 2 h to egress. Scale bar is equal to 15 μm. The lower panel shows a schematic representation of liver stage development at the corresponding time points. b Ratio of luminescence between PbFLuc and PbNLuc signal arising from 6 independent sets of HepG2 cells infected with 10,000 sporozoites each, and lysed at 40 h post-infection. The value for PbFLuc luminescence was set to a value of 1, and the value of PbNLuc luminescence expressed in relation to the PbFLuc value. c Curve of serial dilutions of parasites (1–1000) at 12, 24, 36, 48 and 56 h of development in HepG2 cells. Six sets of 30,000 HepG2 cells were infected with 5000 sporozoites. Parasite numbers were calculated based on mCherry fluorescence, and total parasite load per well calculated. Cells were detached at each indicated time post-infection, and diluted to each indicated values. d Representative IVIS image of luminescence following the kinetics of infection at 12, 24, 36, 48 and 56 h post-infection following infection of HepG2 cells with an initial inoculum of 10,000 sporozoites. e Curve showing kinetics based on fluorescence measurements of total numbers, and sizes of at least 300 parasites at 6, 12, 24, 36, 48 and 56 h post-infection. e, f Represent the fluorescence-based quantification of (d). Parasite sizes (areas, μm2) were calculated based on acquired fluorescence images. f Curve showing kinetics of luminescence alone, corresponding to cells measured in (e) [luminescence measured in photons per second (p/s); ***p < 0.001; error bars in all graphs represent standard deviations (SD)]
