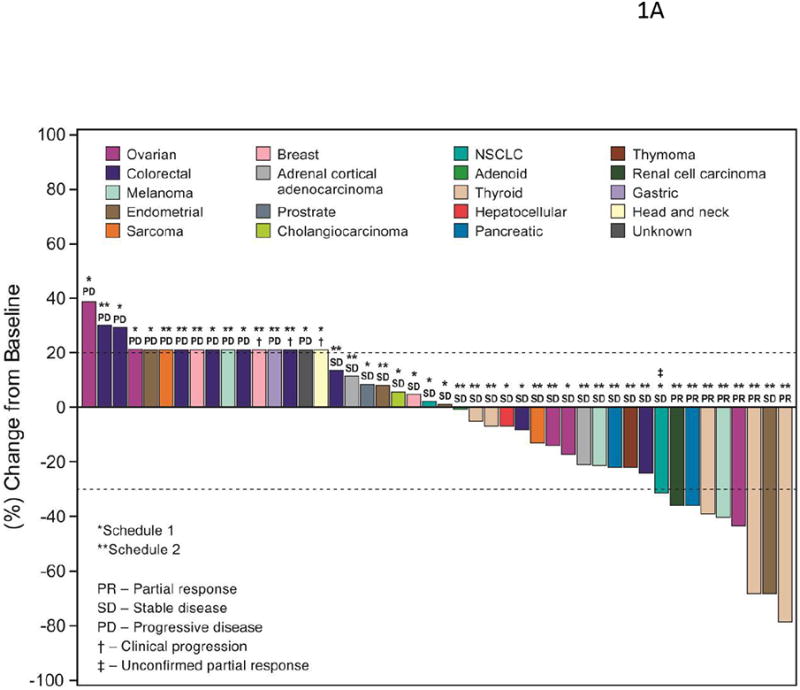
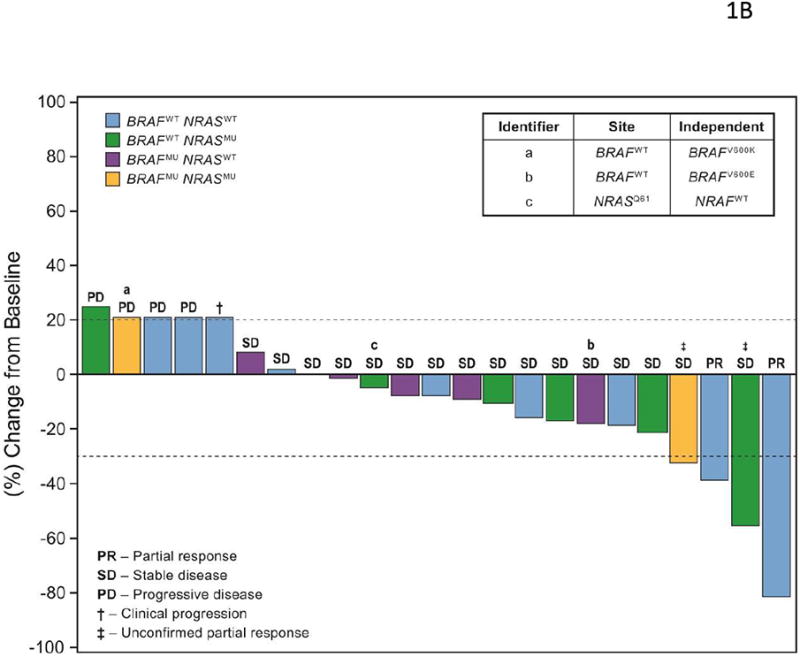
Figure 1.


(A) Waterfall graph showing best response to lenvatinib treatment by RECIST criteria. An arbitrary value of 21% (indicated by †) was assigned for patients who failed early due to clinical progression or new metastatic lesions. The ‡ indicates unconfirmed PR (i.e., initial PR was not confirmed in subsequent tumor assessments, or no further assessments were available). Note that 1 patient's initial designation of SD was changed to PR after the database lock due to overall responses. (B) Waterfall graph for patients in the melanoma expansion cohort: best response to treatment by BRAF and NRAS mutation status. An arbitrary value of 21% (indicated by †) was assigned for patients who failed early due to clinical progression or new metastatic lesions. The ‡ indicates unconfirmed PR, as defined above. Identifiers a, b and c represent patients for whom there was discordance between on-site and independent assessments of either BRAF or NRAS mutation status.
