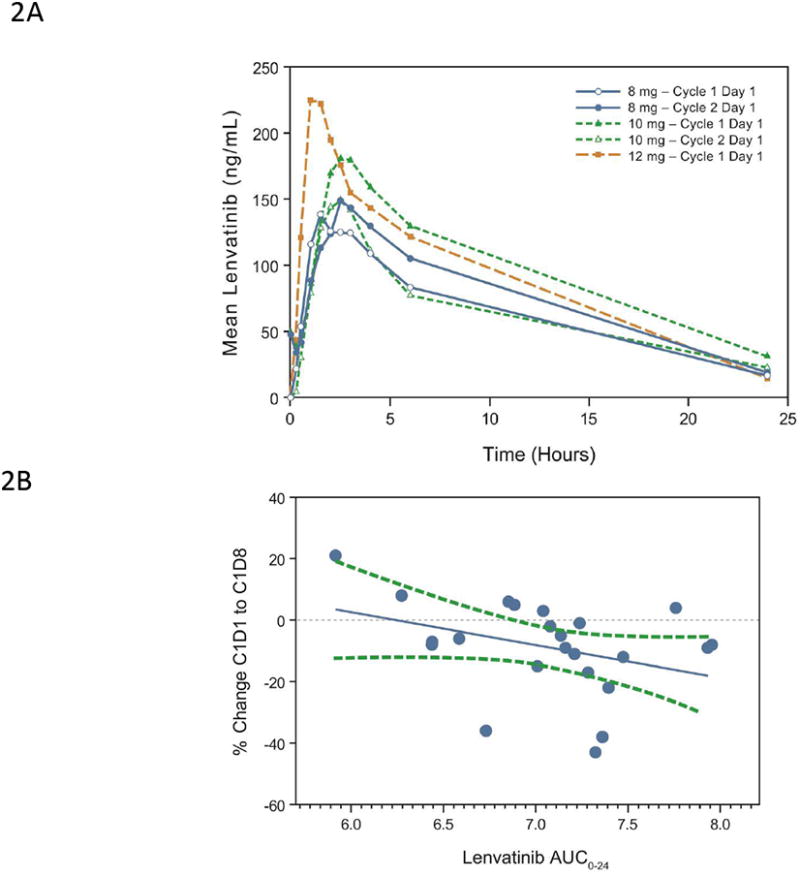
Figure 2.

(A) Single-dose (cycle 1 day 1) and steady-state (cycle 2 day 1) mean observed plasma lenvatinib concentration vs time curve for dose levels 8 mg and 12 mg bid in schedule 2 and 10 mg bid in the expanded melanoma cohort, wherein only 1 dose of the bid dose was administered on cycle 1 day 1 and on cycle 2 day 1. (B) Association of PK exposure with changes in levels of serum sTie-2 protein on cycle 1 day 8 relative to baseline. Shown here is the correlation between AUC0-24 (natural logarithm transformed) and changes in sTie-2 for the expanded melanoma cohort (Spearman correlation R=-0.45, P=0.0322; n=23). Each blue dot represents 1 subject; the solid blue line symbolizes the regression line; and the dashed green lines represent 95% confidence limits.
