
Figure 3.
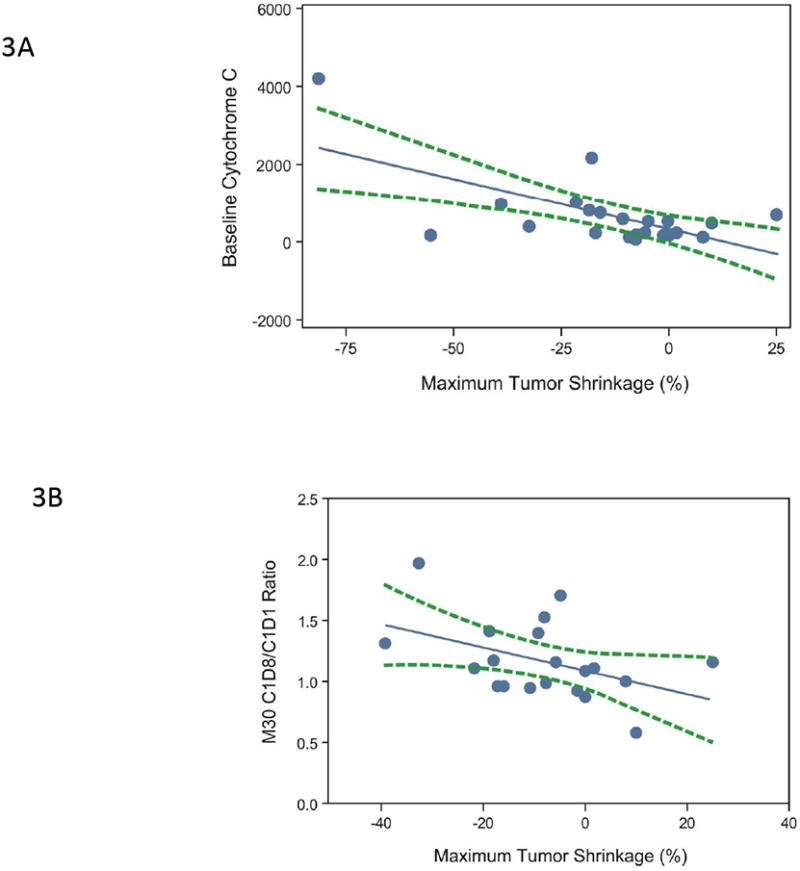
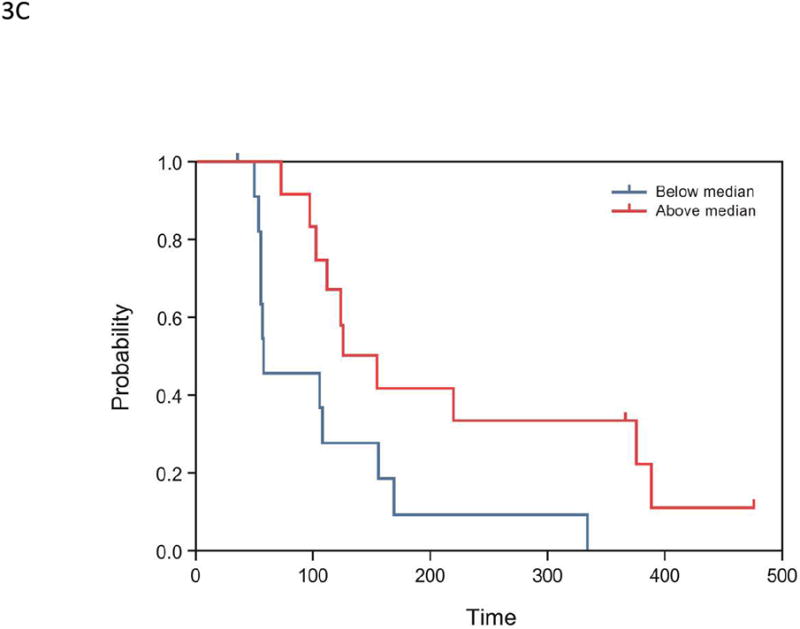
(A) Correlation of maximum tumor shrinkage (%) with baseline cytochrome C levels (n=22): Pearson correlation R=-0.64, P=0.001; Spearman correlation R=-0.45, P=0.0368. (B) Correlation between maximum tumor shrinkage (%) and M30 C1D8/C1D1 ratio (n=20): Pearson correlation R=-0.44, P=0.050; Spearman correlation R=-0.39, P=0.0894. Each blue dot represents 1 subject; the solid blue symbolizes the regression line; and the dashed green lines represent 95% confidence limits. Percent maximum tumor shrinkage was defined as the percentage of reduction in tumor size from baseline to post-baseline nadir. (C) Kaplan-Meier survival estimates of PFS, stratified by early changes in angiopoietin-1 levels, in the expanded melanoma cohort (n=24). Subjects were dichotomized by median ratios of angiopoietin-1 levels (2 hours postdose:baseline, P=0.007).