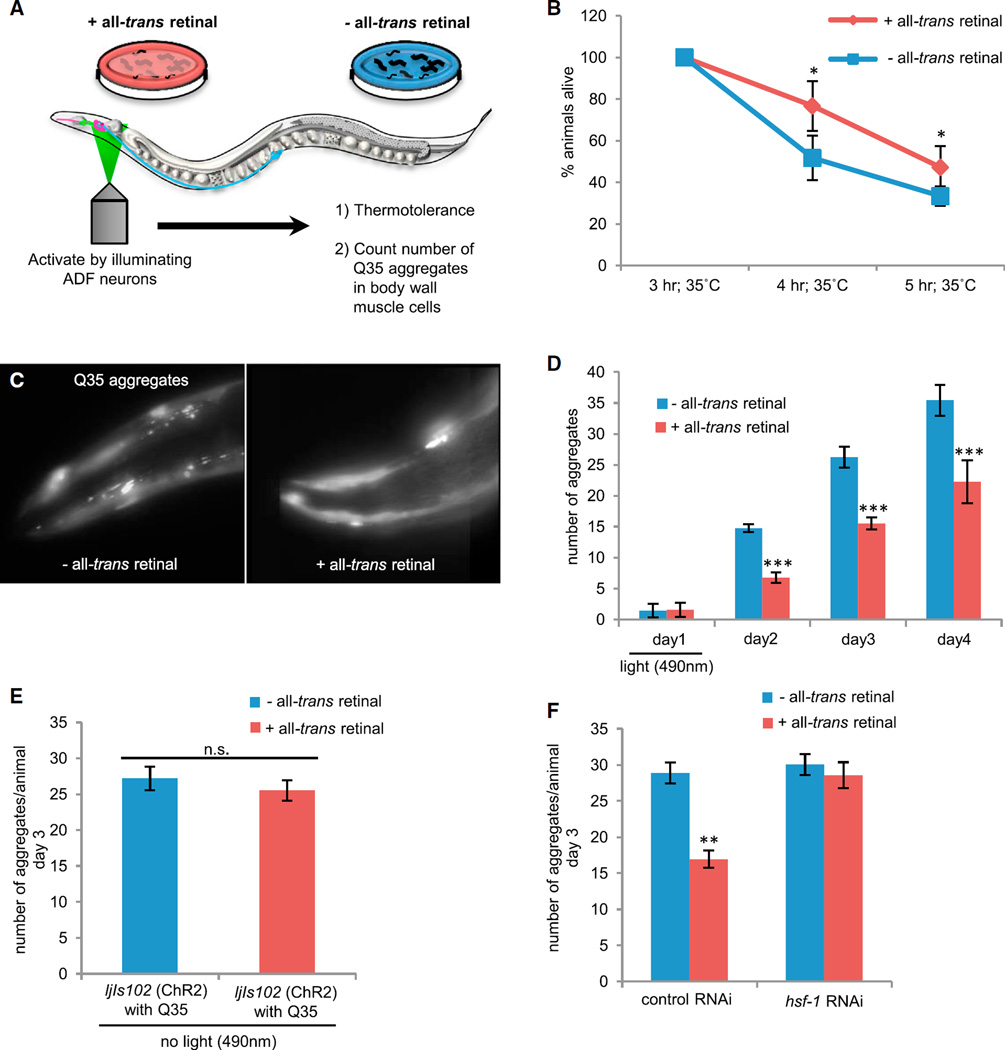
Figure 6. Optogenetic Stimulation of ADF and NSM Neurons Increases Thermotolerance and Suppresses polyQ Aggregation in Body Wall Muscle Cells.
(A) Experimental set up (as described in Figure 5 legend).
(B) Thermotolerance of experimental (+ATR) versus control (−ATR) animals following optogenetic stimulation. n = 80–83 animals per condition; two-way ANOVA; *p < 0.05.
(C) Q35::YFP aggregates visualized in head-muscle cells of control (−ATR) and experimental (+ATR) animals 3 days following optogenetic stimulation.
(D) The number of Q35::YFP aggregates in control (−ATR) and experimental (+ATR) animals over time. n = 7–10 animals per time point per experimental manipulation, t test; ***p < 0.001.
(E) The number of Q35::YFP aggregates in control (−ATR) and experimental (+ATR) animals in the absence of optogenetic stimulation.
(F) The number of Q35::YFP aggregates following RNAi-mediated knockdown of HSF1 in experimental (+ATR) animals following optogenetic stimulation. n = 26, t test; **p < 0.01.

