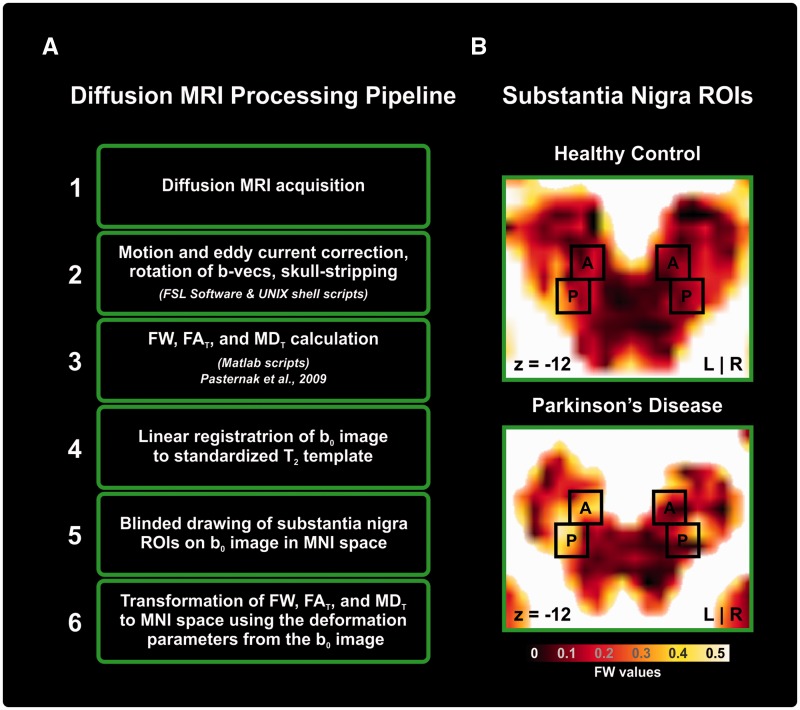
Figure 1.
Processing pipeline and regions of interest. (A) A flow chart that indicates the steps of the diffusion MRI processing pipeline from acquisition to the calculation of diffusion indices. (B) A black-body radiation coloured free-water (FW) image of substantia nigra regions of interest (ROIs) for controls and Parkinson’s disease.

