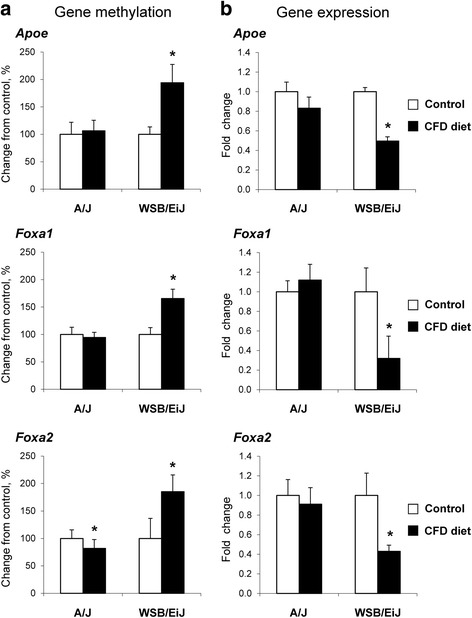
Fig. 4.

Status of promoter cytosine DNA methylation and gene expression of Apoe, Foxa1, and Foxa2 in the livers of mice fed a control or choline- and folate-deficient diet. a Gene-specific cytosine DNA methylation was determined by using MeDIP DNA coupled with real time PCR with primers specific to promoter regions of Apoe, Foxa1, and Foxa2 genes in the livers of control and CFD diet-fed groups. The results are presented as the percent change of promoter methylation of each gene in the livers of mice fed the CFD diet relative to that in control groups, which were assigned a 100 %. b qRT-PCR analysis of Apoe, Foxa1, and Foxa2 gene expression in the livers of mice fed a control or CFD diet. The results are presented as the average fold change in the expression of each gene in the livers of mice fed the CFD diet relative to that in control groups, which were assigned a value 1. White bars – control mice, black bars – mice fed the CFD diet. * - Significantly different from the strain-matched control mice (mean ± SD, n = 5, fold change > 2.0, p <0.05)
