Fig. 3.

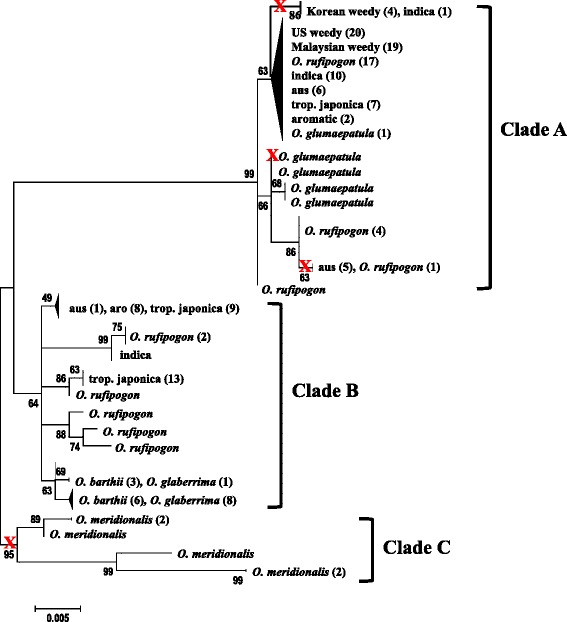
Maximum likelihood phylogeny of PSTOL1. Parentheses contain numbers of accessions within a group. Bootstrap values are percentages from 10,000 replicates. The red X symbol indicates locations of early stop mutations

Maximum likelihood phylogeny of PSTOL1. Parentheses contain numbers of accessions within a group. Bootstrap values are percentages from 10,000 replicates. The red X symbol indicates locations of early stop mutations