
. 2016 Apr 22;15:43. doi: 10.1186/s12938-016-0150-9
© Trumbull et al. 2016
Open AccessThis article is distributed under the terms of the Creative Commons Attribution 4.0 International License (http://creativecommons.org/licenses/by/4.0/), which permits unrestricted use, distribution, and reproduction in any medium, provided you give appropriate credit to the original author(s) and the source, provide a link to the Creative Commons license, and indicate if changes were made. The Creative Commons Public Domain Dedication waiver (http://creativecommons.org/publicdomain/zero/1.0/) applies to the data made available in this article, unless otherwise stated.
Fig. 2.
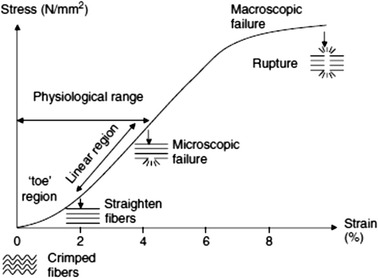
A typical stress–strain curve for tendons showing defined toe, linear and failure regions [57]