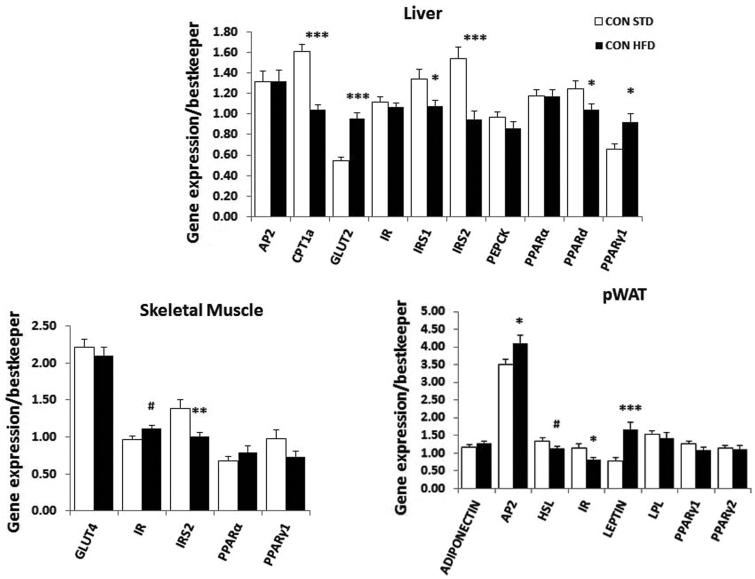
Figure 1.
Molecular effect of HFD feeding in control mice. Real-time PCR analysis of candidate genes measured in the liver, muscle, and pWAT of control mice fed a standard (STD) or a high-fat diet (HFD). Data were analyzed using unpaired t-test, #p < 0.07 (tendency only), *p < 0.05, **p < 0.01, and ***p < 0.001. Number of mice per group (n): STD CON n = 16–19, HFD CON n = 20–23. Data are mean ± SEM.

