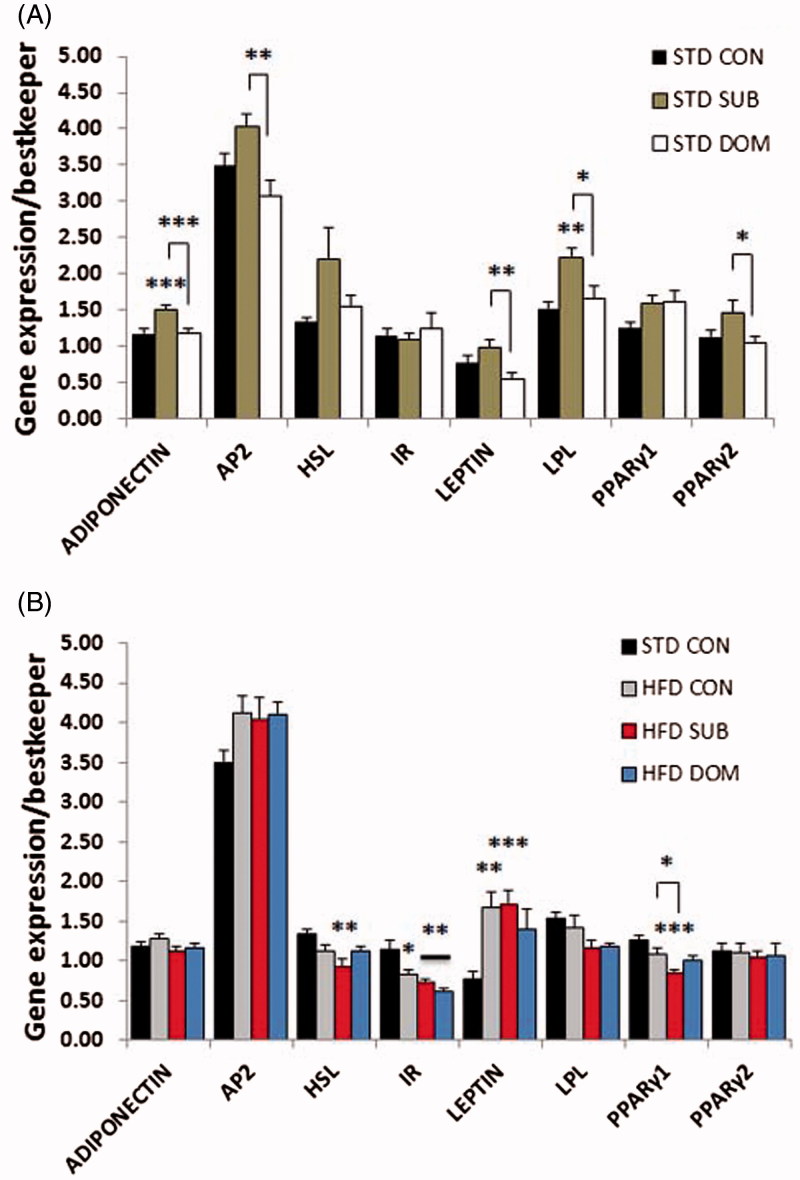
Figure 4.
qPCR analysis of candidate genes in the pWAT of subordinate (SUB) and dominant (DOM) mice fed a (A) standard diet (STD) and (B) high-fat diet (HFD) compared to Controls (CON). Data were analyzed using two-way ANOVA followed by Tukey’s HSD post hoc test. #p < 0.07, *p < 0.05, **p < 0.01, and ***p < 0.001. Asterisk (*) represents significant differences, hash sign (#) alone indicates tendency, vs. CON mice; bars identify significant differences between indicated treatments. Number of mice per group (n): STD CON n = 16–19, STD SUB n = 20–22, STD DOM n = 15–23, HFD CON n = 20–23, HFD SUB n = 22–26, HFD DOM n = 7–8. Data are mean ± SEM. This figure will be best described with colors at the online version.

