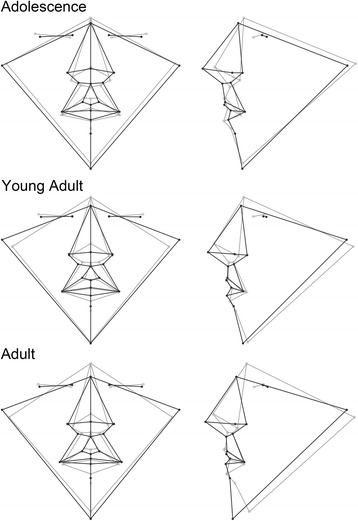
Fig. 4.

Wireframe models showing shape differences between male and female faces based on discriminant function analysis. The black wireframe represents the mean male face shape, while the gray wireframe represents the mean female shape. Each row shows results for a different age group: top row—adolescence, middle row—young adult, bottom row—adult. The wireframes in the first column (page left) show the shape differences in frontal view, while the wireframes in the second column (page right) show the lateral or profile view. Shape changes magnified ×5 for clarity
