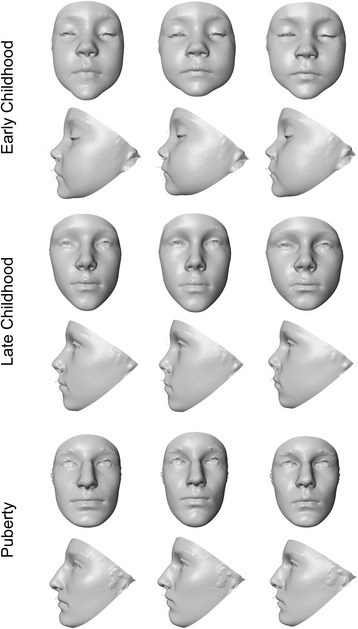
Fig. 5.

Facial surface warps showing the shape variation associated with discriminant function analysis separating males from females. Each row shows results for a different age group: top row—early childhood group, middle row—late childhood, bottom row—puberty. The middle face in each row represents an average (gender neutral) face for each age group. The left face in each row shows the average face warped to the female mean shape. The right face in each row shows the average face warped to the male mean shape. Shape changes magnified ×5 for clarity
