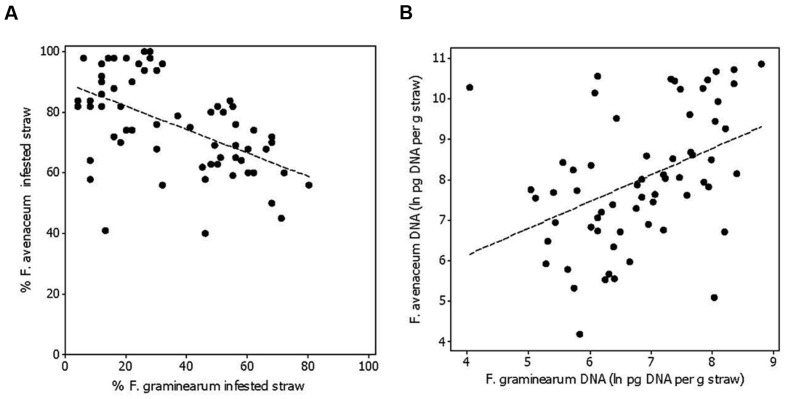
FIGURE 3.
The relationship between the percentage of oat straw residues within a field plot infested with Fusarium avenaceum and F. graminearum (R2adj = 27%, p < 0.001) (A), and the relationship between the amount of F. avenaceum DNA compared to F. graminearum DNA calculated as ln pg DNA per gram of straw residue (R2adj = 16%, p = 0.001; B). The residues were collected after sowing in spring at Solør and Østfold locations in the years 2011 and 2012.

