
Figure 2.
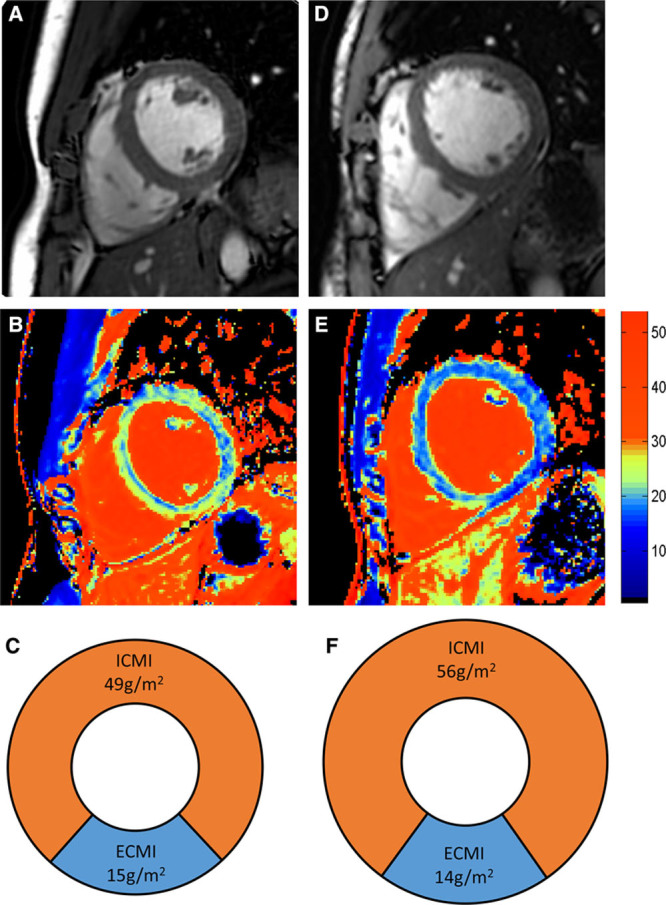
Typical cardiac magnetic resonance (CMR) appearances in low-performance and high-performance athletes. Left column shows an athlete with a  O2max of 50 mL/kg per in, and right column shows a high-performance athlete with a
  O2max of 75 mL/kg per min. A and D, Short-axis images of left and right ventricle. B and E, extracellular volume (ECV) color maps showing lower ECV in the high performance athletes throughout the myocardium. C and F, Pie charts scaled to overall indexed LV mass displaying the relative indexed masses of the cellular and extracellular compartments (not short axis images). ECMI indicates indexed extracellular mass; and ICMI, indexed intracellular mass.