
Figure 25:
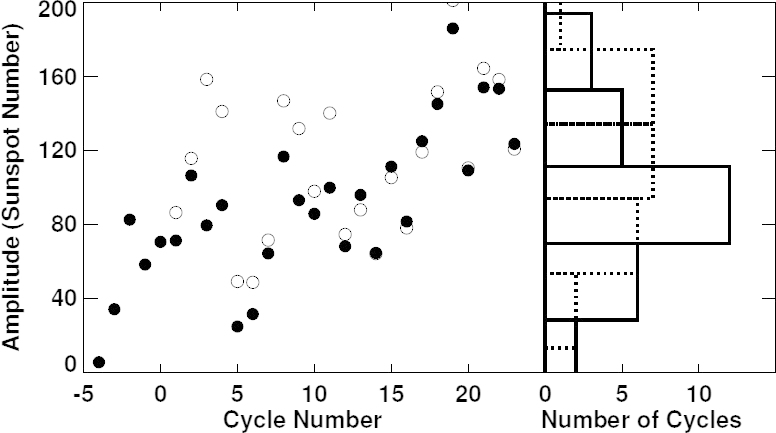
The left panel shows cycle amplitudes as functions of cycle number. The filled circles show the 13-month mean maxima with the Group Sunspot Numbers while the open circles show the maxima with the International Sunspot Numbers. The right panel shows the cycle amplitude distributions (solid lines for the Group values, dotted lines for the International values). The Group amplitudes are systematically lower than the International amplitudes for cycles prior to cycle 12 and have a nearly normal distribution. The amplitudes for the International Sunspot Number are skewed toward higher values.