
Figure 31:
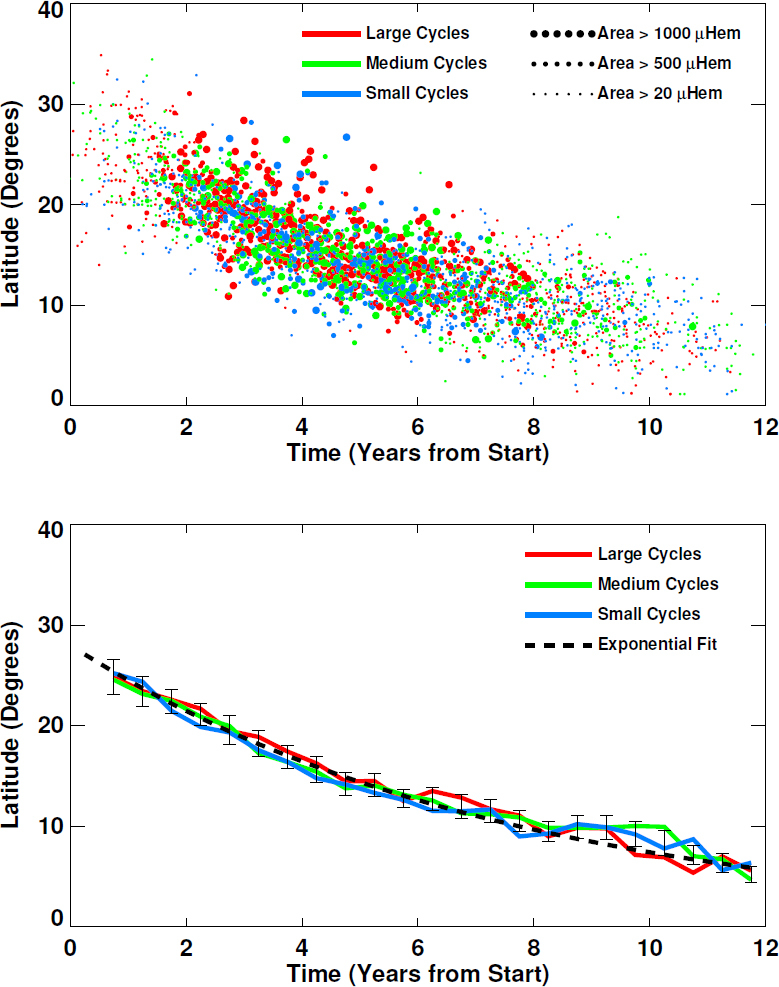
Top: Latitude positions of the sunspot area centroid in each hemisphere for each Carrington Rotation as functions of time from cycle start. Three symbol sizes are used to differentiate data according to the average of the daily total sunspot area for each hemisphere and rotation. Bottom: The centroids of the centroids in 6-month intervals are shown for large amplitude cycles (red line), medium amplitude cycles (green line), and small amplitude cycles (blue line). The exponential fit to the active latitude positions [Eq. (8)] is shown with the black dashed line and 2σ error bars.