
Figure 32:
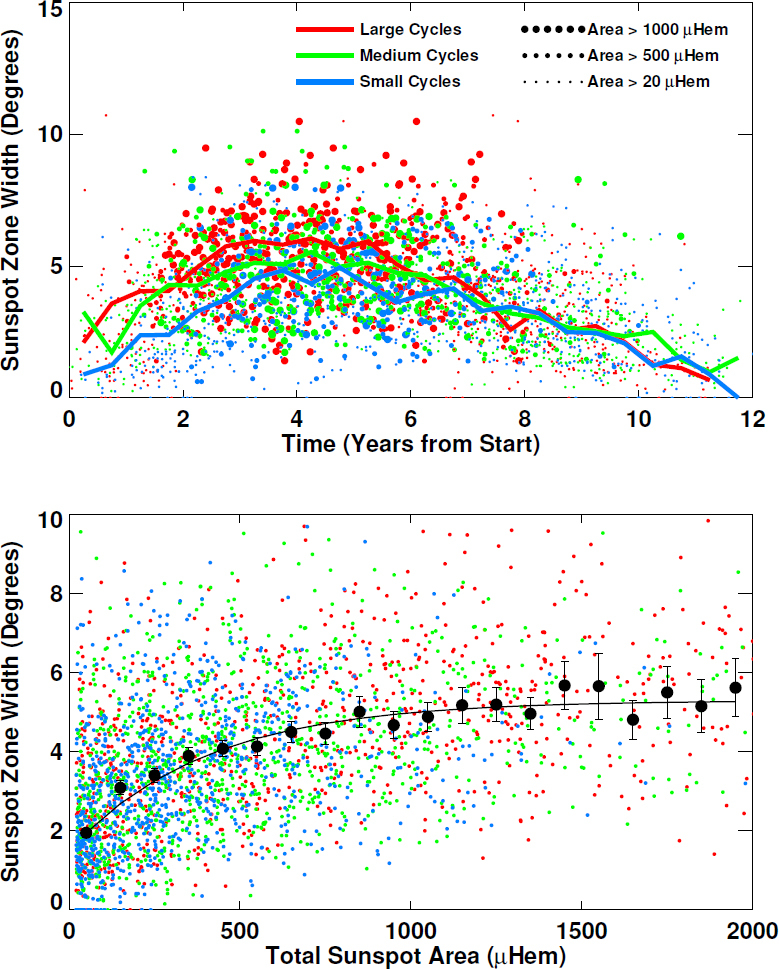
Top: Latitudinal widths of the sunspot area centroid in each hemisphere for each Carrington Rotation as functions of time from cycle start. Three symbol sizes are used to differentiate data according to the daily average of the sunspot area for each hemisphere and rotation. The centroids of the centroids in 6-month intervals are shown for large amplitude cycles (red line), medium amplitude cycles (green line), and small amplitude cycles (blue line). Bottom: Latitudinal widths as functions of total sunspot area with color coded symbols for cycle strength. The black dots with 2σ error bars show the data binned in 100 µHem intervals. The black line is given by Eq. 9.