
Figure 8:
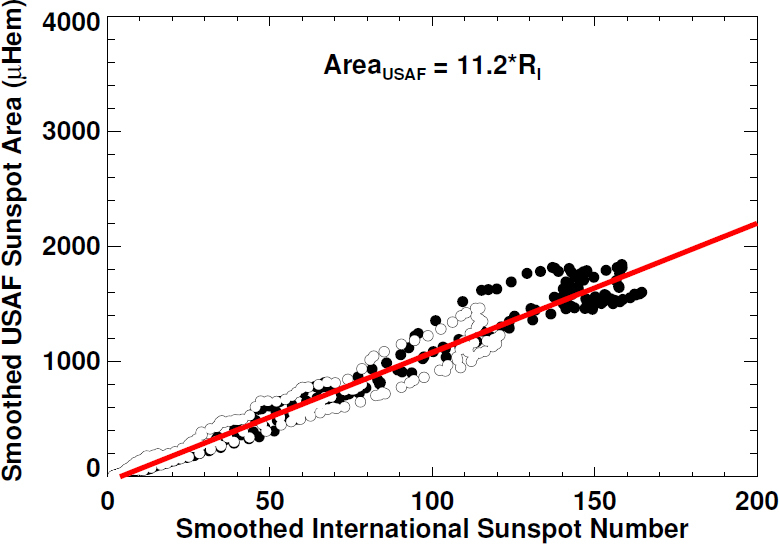
Smoothed USAF/NOAA Sunspot Area vs. the International Sunspot Number at monthly intervals from January 1977 to August 2014. The two quantities are correlated at the 99.1% level with a proportionality constant of about 11.2. These sunspot areas have to be multiplied by a factor of 1.49 to bring them into line with the RGO sunspot areas. Data obtained prior to cycle 23 are shown with filled dots, while data obtained after 1997 are shown with open circles.