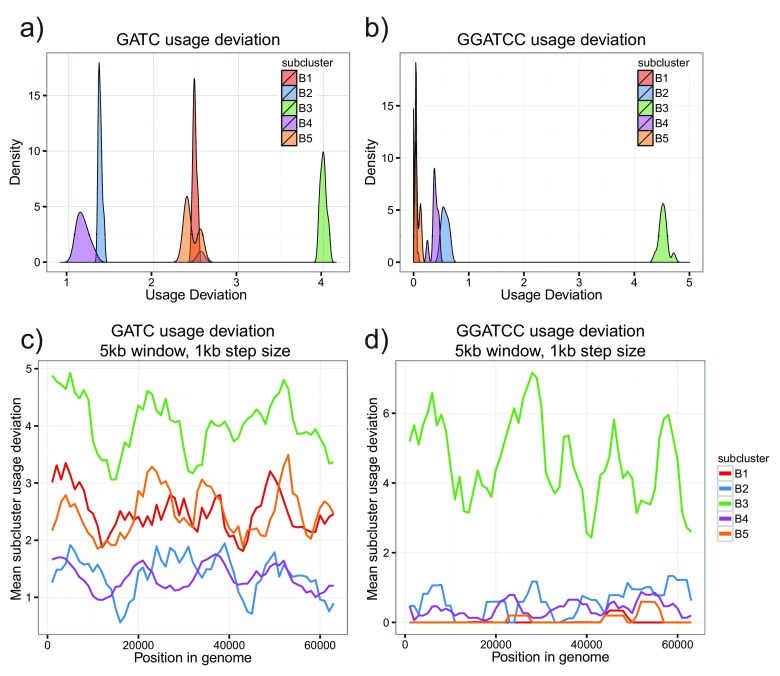
Figure 7. GATC and GGATCC are overrepresented in B3 phages.
a) Density plot of TUD values for the 4-mer GATC. Individual subclusters form well-defined groups. B3 phages have GATC usage four times what is expected, much higher than other B subclusters. b) Repeat of (a) with the 6-mer GGATCC. B3 phages use this 6-mer greater than four times what is expected. c) GATC usage deviation in a sliding window (5kb, 1kb step size). Each line represents the mean value in the specified subcluster. The increase in GATC usage is genome-wide, indicative of a global change in usage frequency. d) Repeat of (c) with the 6-mer GGATCC. Increased usage is also genome-wide.

