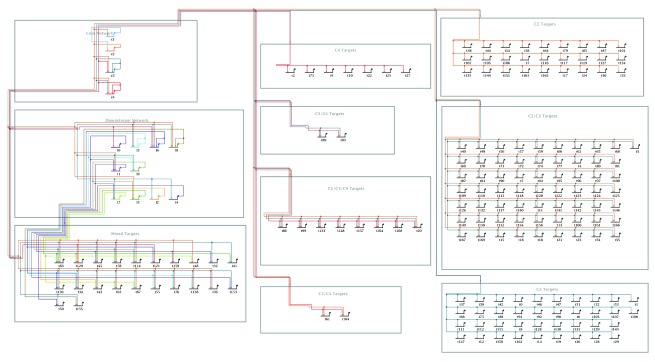
Figure 4. Example of overlay-driven strategy.
This example is the end result of the overlay-driven layout use case described below. Using a simulated GRN data set (see Supplemental File 1 - https://f1000researchdata.s3.amazonaws.com/supplementary/7620/671ed832-fd5f-4130-a21e-c94b645b6720.sif), it groups genes into separate network modules. Two modules (upper and center left) contain “control genes”, while all other target genes are separated into modules based on their combination of inputs. Here the overlay intensity level is set near the minimum to de-emphasize the overlay features.

