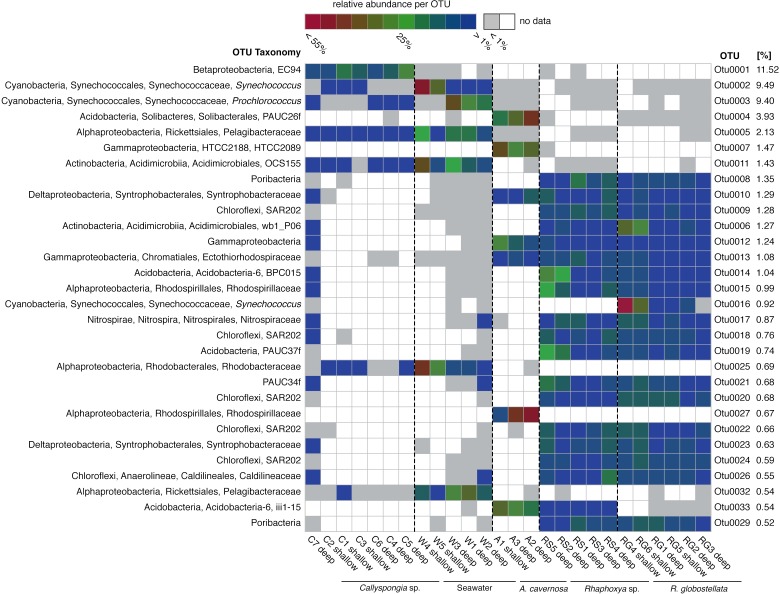
Figure 2. Most abundant 97%-OTUs.
Fingerprint of the 30 most abundant 97%-OTUs (>0.5%) based on relative abundance for each individual OTU. Greengenes classifications from phylum to species level are provided on the left. On the right are relative abundances of the individual 97%-OTUs in relation to all detected OTUs.

