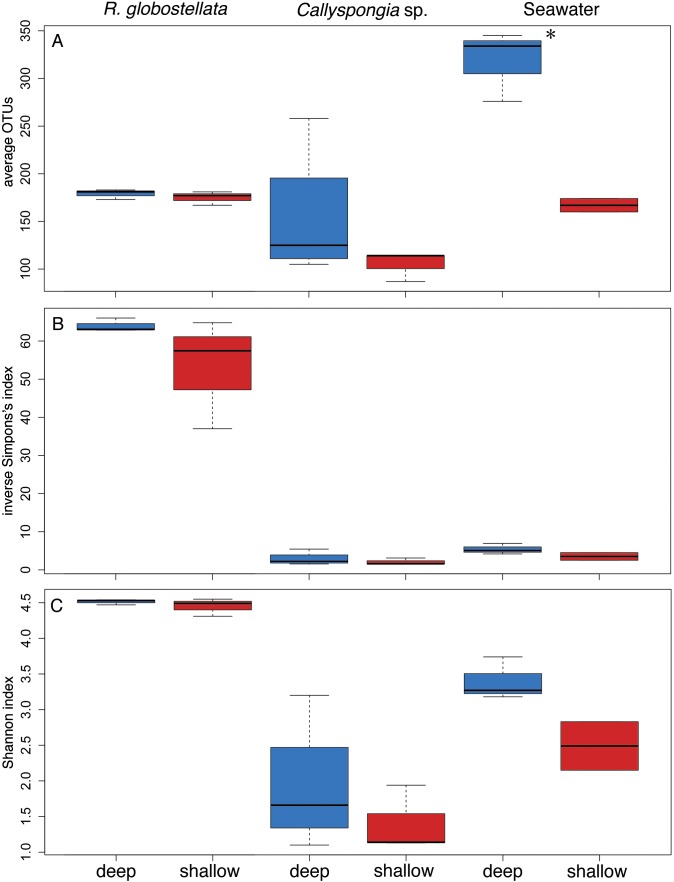
Figure 5. Alpha diversity comparisons between habitats.
Number of (A) average 97%-OTUs and alpha diversity estimates, (B) inverse Simpson’s and (C) Shannon index for shallow reef slopes and deep reef drop-off R. globostellata, Callyspongia sp. and seawater samples. Top, middle, and bottom lines of the boxes represent the 25th, 50th (median), and 75th percentiles, respectively. The end of the whiskers represent the 5th and 95th percentiles, respectively. Blue and red habitat colors correspond with the color code in Fig. 3. Measurements of observed average OTUs, inverse Simpson’s index and Shannon index were analyzed using a one-way analysis of variance (ANOVA, p < 0.05) using habitat as a fixed factor. Significant results are marked by an asterisk.

