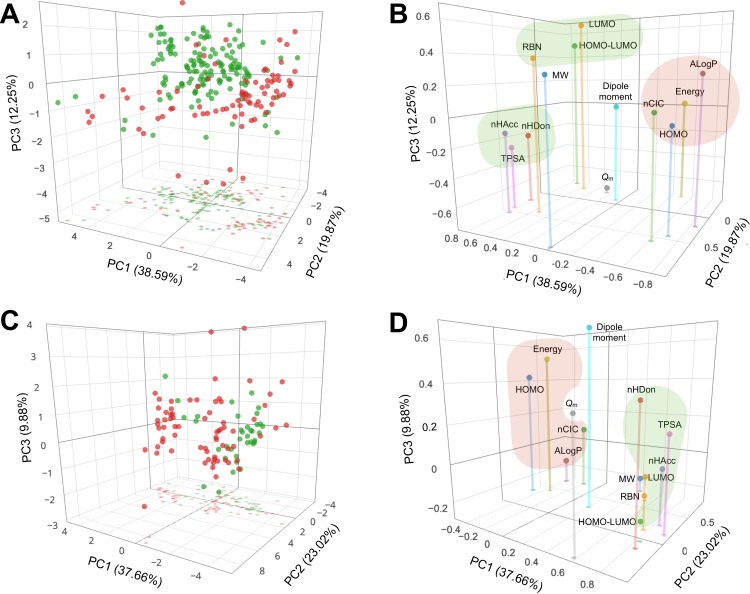
Figure 4. PCA scores and loadings plots of NAIs against influenza A (A and B, respectively) and B (C and D, respectively).
Active and inactive compounds are represented by green and red circles, respectively, in the scores plots. Important features for rationalizing the active and inactive compounds are highlighted by green and red clusters, respectively. An interactive version is available at https://dx.doi.org/10.6084/m9.figshare.3123136.v1.

