
FIGURE 1.
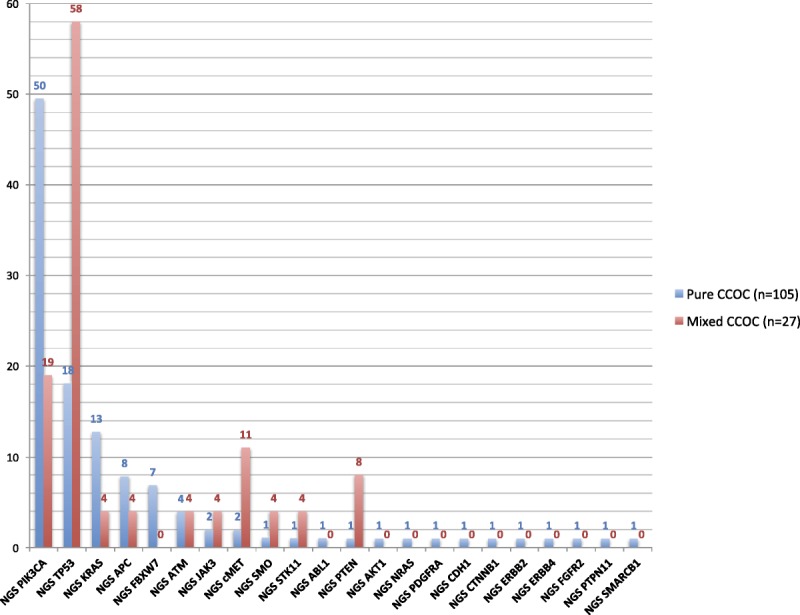
Prevalence of all mutations in pure (n = 105) versus mixed (n = 27) CCOCs by NGS. P values for the comparison of pure versus mixed CCOC samples are as follows: PIK3CA, P = 0.0119; TP53, P < 0.0001; KRAS, P = 0.1944; cMET, P = 0.0254. For all of the other comparisons shown in the graph: P ≥ 0.05. Tested genes that showed no alterations included the following: ALK, BRAF, CSF1R, EGFR, FGFR1, FLT3, GNA11, GNAQ, GNAS, HNF1A, IDH1, JAK2, KDR, MPL, NOTCH1, NPM1, RB1, RET, SMAD4, and VHL.