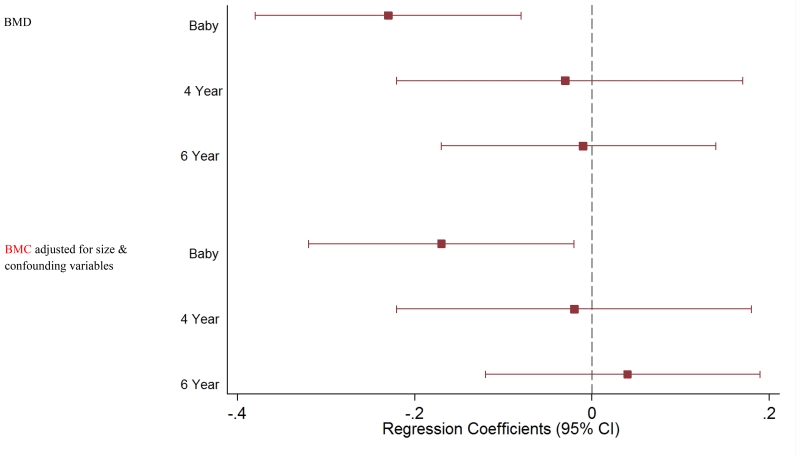
Figure 2. Regression coefficients expressing the relationship between child BMD and number of fast food outlets in their neighbourhood after adjustment for size and confounding variables.
Confounding variables included: neighbourhood deprivation, maternal smoking status, maternal physical activity levels, maternal diet score, maternal body mass index (BMI) and child gender; infant models additionally adjusted for gestational age and age at scan; 6 year models additionally adjusted for age at scan.

