Figure 6.
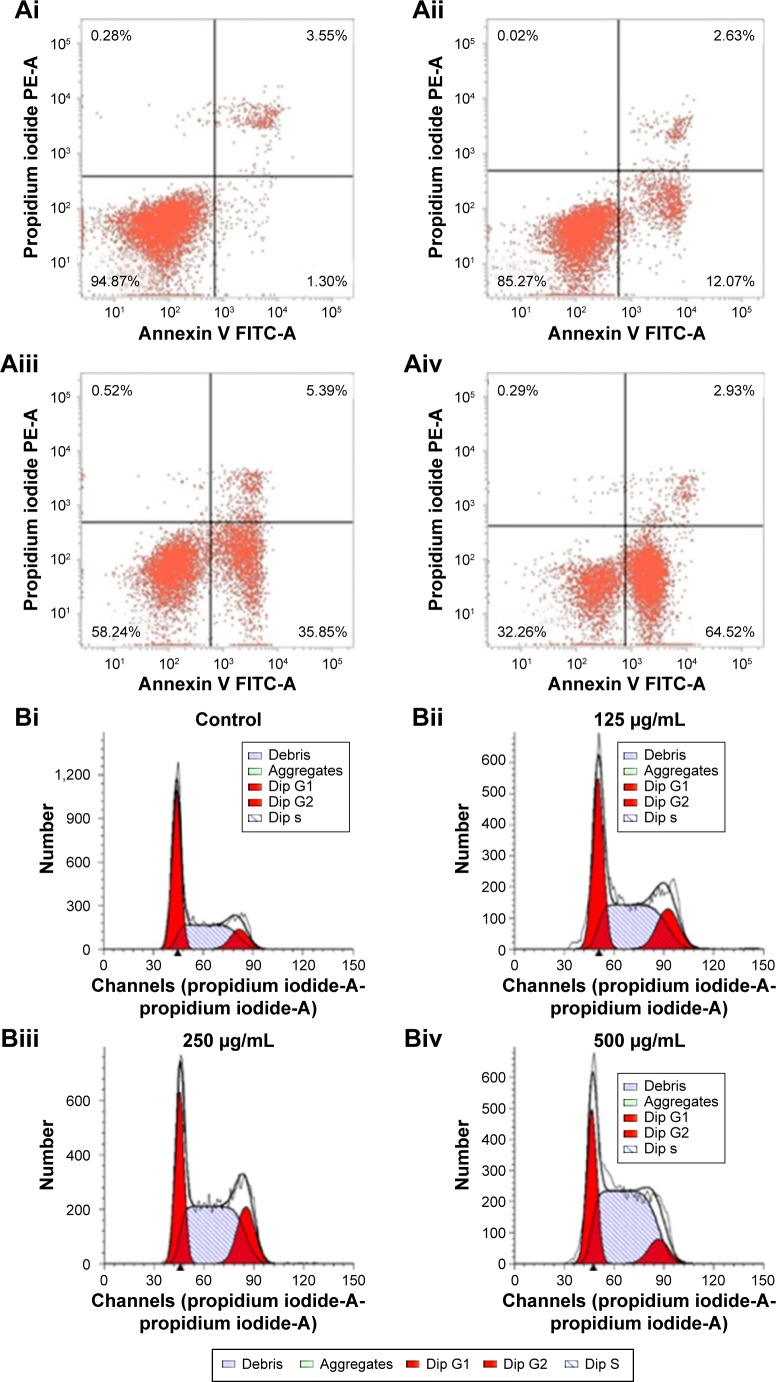
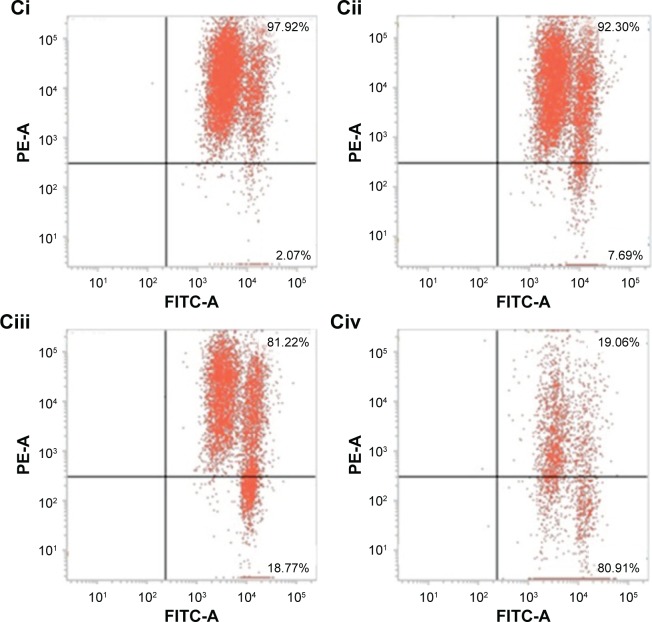
(Ai–Aiv) Induction of MCF-7 cell apoptosis with WP1-SeNPs. (Bi–Biv) Cell-cycle distribution of MCF-7 cells treated with WP1-SeNPs. (Ci–Civ) Loss of mitochondrial membrane potential of MCF-7 cells treated with WP1-SeNPs.
Notes: (Ai) Control group (cells without treatment by WP1-SeNPs); (Aii) cells treated with 125 μg/mL WP1-SeNPs for 48 hours; (Aiii) cells treated with 250 μg/mL WP1-SeNPs for 48 hours; (Aiv) cells treated with 500 μg/mL WP1-SeNPs for 48 hours. The lower left (LL) quadrant represents the proportion of normal cells, the lower right (LR) quadrant represents the proportion of early apoptotic cells, and the upper left (UL) and upper right (UR) quadrants represent the proportion of necrosis and late apoptosis cells, respectively. (Bi) control group (cells without treatment by WP1-SeNPs); (Bii) cells treated with 125 μg/mL WP1-SeNPs for 48 hours; (Biii) cells treated with 250 μg/mL WP1-SeNPs for 48 hours; (Biv) cells treated with 500 μg/mL WP1-seNPs for 48 hours. (Ci) Control group; (Cii) cells treated with 125 μg/mL WP1-SeNPs; (Ciii) cells treated with 250 μg/mL WP1-SeNPs; (Civ) cells treated with 500 μg/mL WP1-SeNPs. The upper right (UR) and lower right (LR) quadrants represent the proportion of red fluorescence and green fluorescence, respectively.
Abbreviation: WP1-SeNPs, walnut peptide 1-selenium nanoparticles.


