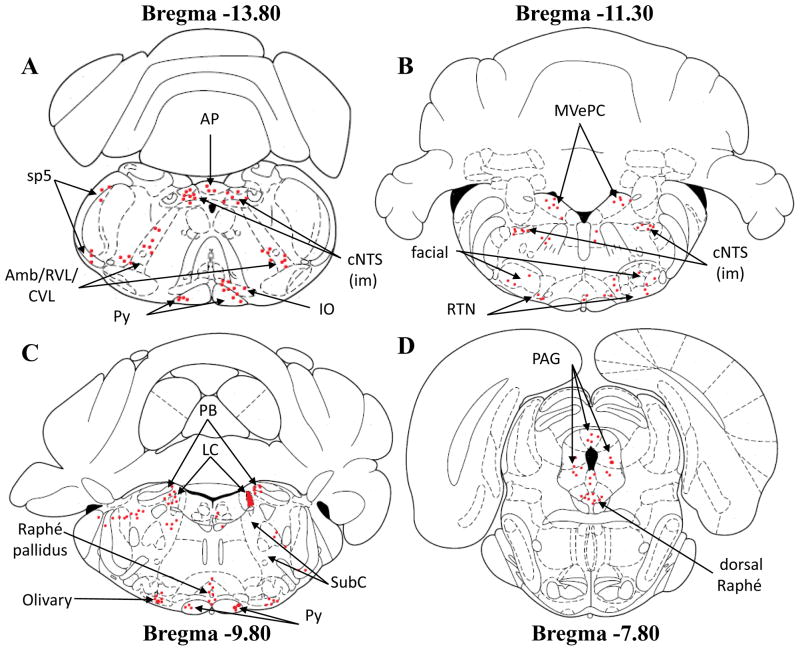
Figure 1.
Schematic drawings of four different slices showing the location of retrogradely-labeled neurons (red dots) in different brain regions from neonatal rats injected with rhodamine beads into the right side of the LC. Note that the microinjection site of rhodamine beads is represented in schema 3C on LC right side. The schematic drawings are taken from Paxinos and Watson (1997). Each red dot represents a distinct neuron loaded with fluorescent rhodamine. Amb/RVL/CVL: ambiguus nucleus/rostroventrolateral reticular nucleus/caudoventrolateral reticular nucleus; AP: area postrema; cNTS: caudal nucleus tractus solitarius; iNTS: intermediate nucleus tractus solitarius; IO: inferior olive; LC: locus coeruleus; MVePC: medial vestibular nucleus, parvicellular part; PAG: periaqueductal gray; PB: parabrachial nucleus; Py: pyramidal tract; RTN: retrotrapezoid nucleus; SubC: subcoeruleus; sp5: spinal trigeminal tract.

