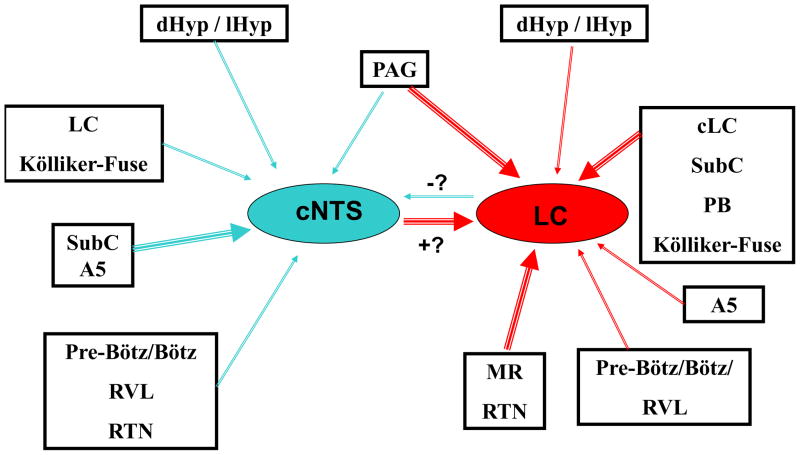
Figure 11.
Schematic diagram of the interconnections among several putative chemosensitive regions of the brainstem, based on our retrograde labeling data. Red arrows indicate afferent projections to the LC while blue arrows represent afferent projections to the cNTS. Thicker arrows indicate stronger retrograde labeling and thus more projecting neurons while thinner arrows represent weaker labeling and thus fewer projecting neurons. The blue arrow connecting LC to cNTS is marked with a “−?” to indicate that this connection may be inhibitory (based on the electrophysiology data) but that this is uncertain until the predominant neurotransmitter of these neurons is known. The red arrow connecting cNTS to LC is marked with a “+?” to indicate that this connection may be excitatory (based on the electrophysiology data) but that this is uncertain until the predominant neurotransmitter of these neurons is known. cNTS: caudal region of the nucleus tractus solitarius near the area postrema; contralateral LC: locus coeruleus on the side opposite the site of injection; dHyp/lHyp: dorsomedial and lateral hypothalamus; LC: locus coeruleus; MR: medullary raphe; PAG: periaqueductal gray; PB: parabrachial nucleus; RTN: retrotrapezoid nucleus; SubC: subcoeruleus region; Pre-Bötz/Bötz:: Pre-Bötzinger complex and Bötzinger complex; RVL: rostroventrolateral reticular nucleus.

