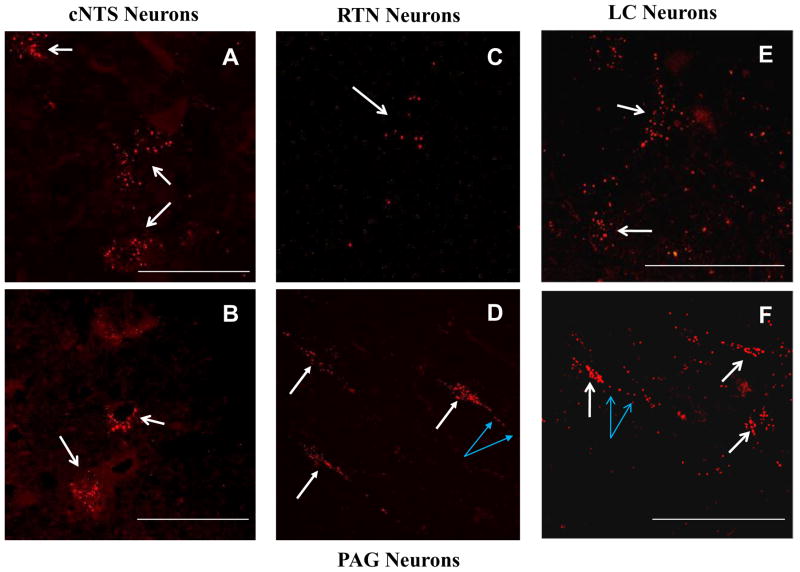
Figure 7.
Confocal images of retrogradely-labeled neurons after injection of rhodamine stack images. A, B: Neuronal cell bodies from the cNTS loaded with rhodamine beads (red fluorescence) (white arrows) indicating that neurons from the cNTS have afferent projections to the LC. Note multiple rhodamine beads in each soma indicating heavy retrograde labeling; C: A neuronal cell body from the area of the RTN loaded with rhodamine beads (red fluorescence) (white arrow). Note there are several rhodamine beads in the soma; D: Neuronal cell bodies from the PAG loaded with rhodamine beads (red fluorescence) (white arrows) indicating that neurons from the PAG have afferent projections to the LC. Note multiple rhodamine beads in each soma. Also note the presence of rhodamine beads in a neuronal process (blue arrows); E, F: Neuronal cell bodies from the LC loaded with rhodamine beads (red fluorescence) (white arrows) indicating that neurons from the LC have afferent projections to the cNTS. Note multiple rhodamine beads in each soma indicating heavy retrograde labeling. Also note the presence of rhodamine beads in neuronal processes (blue arrows in F). cNTS: caudal nucleus tractus solitarius; LC: locus coeruleus; PAG: periaqueductal gray; RTN: retrotrapezoid nucleus. The calibration bar in each image represents 50 μm.

