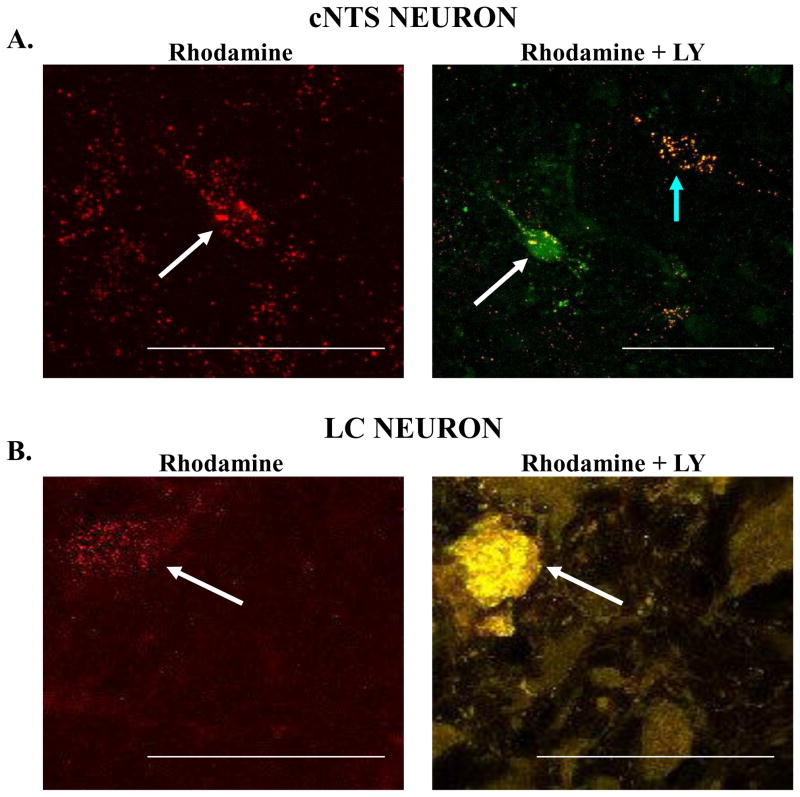
Figure 8.
A: Neurons from the cNTS that have been retrogradely labeled with rhodamine beads injected into the LC. In the left panel is indicated a cNTS neuronal cell body with numerous rhodamine beads (white arrow). This neuron was patched and studied electrophysiologically and then loaded with Lucifer Yellow (LY). In the right panel the same neuron seen in the left panel shows extensive loading with LY (green fluorescence) with several yellow dots that indicate the overlap of the rhodamine beads seen in the left panel with LY (white arrow). Note a separate neuron that is loaded with rhodamine beads but not with LY (blue arrow); B: In the left panel is a neuron from the LC that has been retrogradely labeled with rhodamine beads (white arrow) injected into the cNTS. This neuron was studied electrophysiologically and then loaded with LY, but at the end of the recording, the neuron was damaged (white arrow). It is clear that the LY-loaded neuron is in the same location as the rhodamine-labeled neuron in the left panel. All images shown are merged Z stack images. The calibration bar in each image represents 50 μm.

