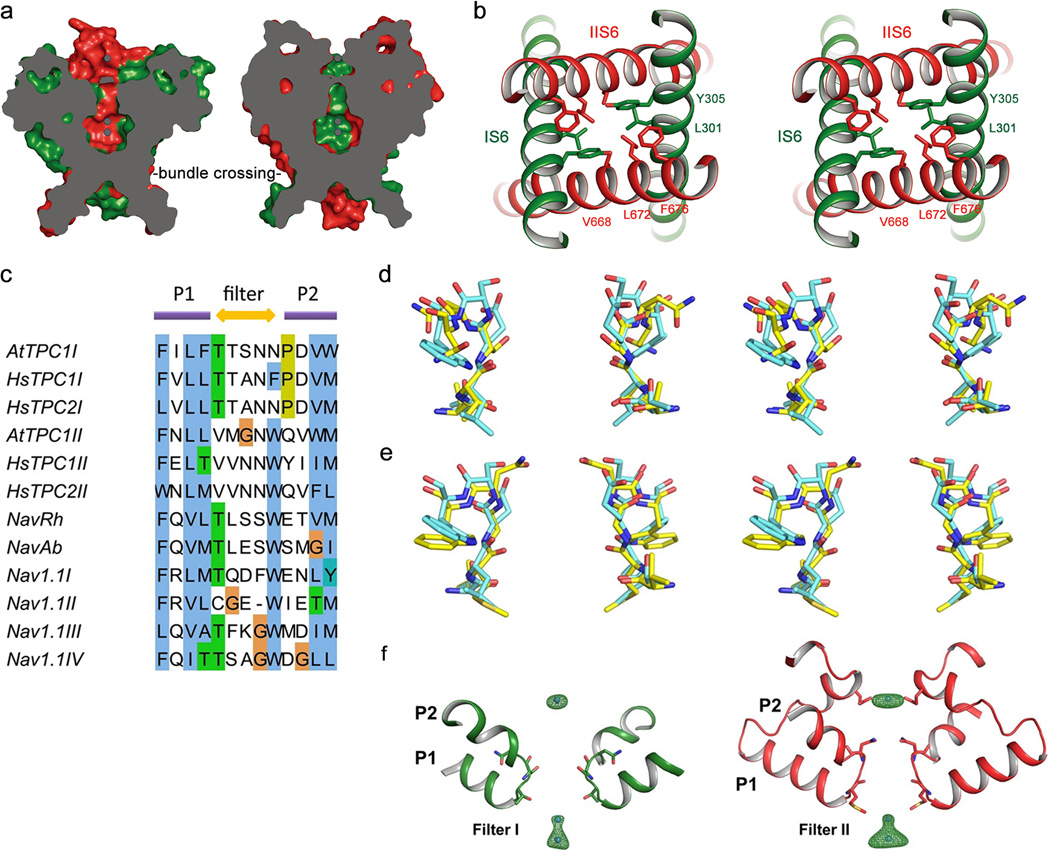
Extended Data Figure 4. The ion conduction pore of AtPTC1.
a, Cross sections of surface rendered AtTPC1 pore along IS6 pair (left) and IIS6 pair (right). The channel is closed at the bundle crossing. b, Stereo view of the bundle crossing region from the cytosolic side. c, Partial sequence alignment of the selectivity filters from two pore channels (AtTPC1, HsTPC1 and HsTPC2), bacterial sodium channels (NavRh and NavAb) and human voltage-gated sodium channel Nav1.1. d, Stereo view of the structural alignment between AtTPC1 Filter I (carbon in yellow) and NavAb filter (carbon in cyan). e, Stereo view of structural alignment between AtTPC1 Filter II and NavAb filter. f, Anomalous difference Fourier map of native crystal (green mesh, 4.5 σ level) reveals the bound Ba2+ along the ion conduction pathway. The two cavity sites are likely occupied by a single Ba2+ ion alternatively, as the two sites are only 3 Å apart, too close to accommodate two ions simultaneously.

