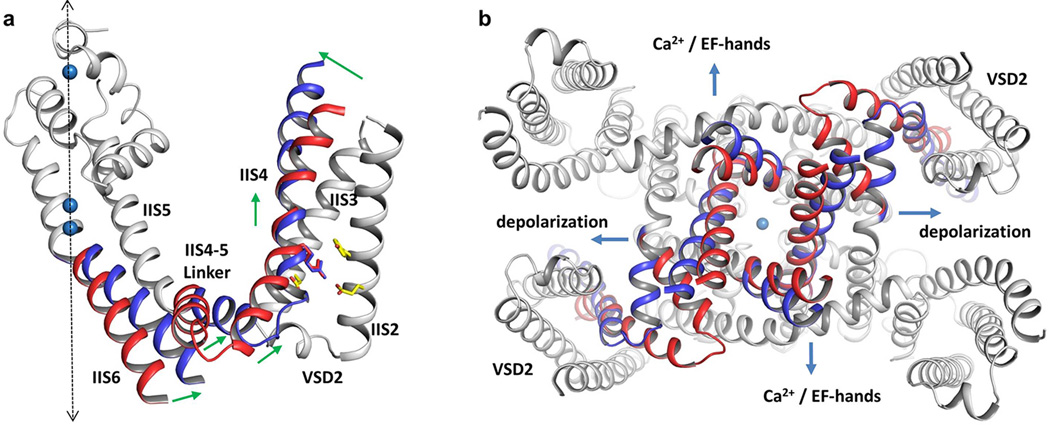
Extended Data Figure 8. Proposed model for AtTPC1 activation.
a, The model of AtTPC1 6-TM II in voltage-activated state is generated based on the structural comparison between AtTPC1 and NavAb. Only IIS4, IIS4–S5 linker and IIS6 are considered as the moving parts, assuming IIS6 moves concurrently with IIS4–S5 linker. The moving parts are colored red for resting state and blue for activated state. The rest of the protein is colored in grey. Green arrows indicate the directions of the movement at N-terminus, middle part, and C-terminus of IIS4, and at IIS4–S5 linker and C-terminus of IIS6. Dashed arrow indicates the central axis of the channel. b, Cytosolic view of the channel opening mechanism. Compared with the closed state (red), membrane depolarization and calcium binding to EF hand domain lead to the opening of IIS6 and IS6 (modeled in blue), respectively.

