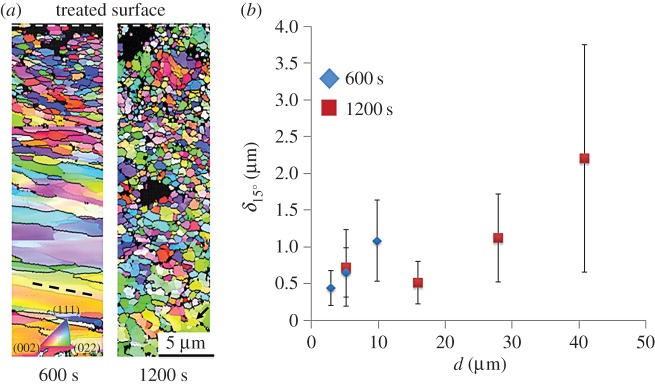
Figure 5.
(a) Orientation imaging microscopy using electron back scattered diffraction of treated surface, (b) variation in grain size δ15° with respect to depth d from treated surface. Dashed line in (a) shows orientation of dislocation structures. Arrow in (a) points at zone featuring poorly aligned dislocation structures. (Online version in colour.)

