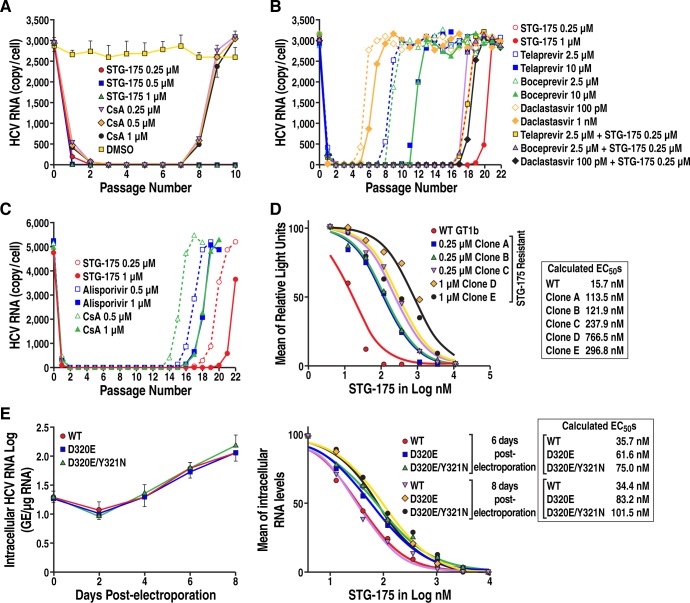
Fig 3. Replicon clearance, replication rebound and resistance analyses.
A. Clearance and replication rebound: Con1 replicon Huh-7 cells were passaged 7 times in the absence or presence of STG-175 or CsA (0.25, 0.5 and 1 μM). Then drugs were removed to allow viral replication rebound to occur. At each passage, samples of cells were collected, RNA extracted and analyzed by RT-PCR for HCV RNA levels. B. Emergence of resistance: Con1 replicon Huh-7 cells were passaged 22 times in the absence or presence of STG-175 or selected DAAs. At each passage, sample of cells were collected, RNA extracted and analyzed by RT-PCR for HCV RNA levels. C. Same as B except that selected CypI were compared–STG-175, ALV and CsA. Data are expressed as number of HCV RNA copies per cell. Data are representative of two independent experiments. D. Degree of resistance of STG-175-resistant colonies: STG-175-resistant colonies, which emerged under drug selection, were analyzed for their resistance to increasing concentrations of STG-175. Data are expressed as mean of relative light units and calculated EC50s are presented. Data are representative of two independent experiments. E. Degree of resistance of D320E and Y321N Con1 variants: Left panel. Wild-type (WT), D320E and D320/Y321N NS5A Con1 RNA were electroporated into Huh7.5.1 cells and replication monitored over 8 days by quantifying the levels of intracellular HCV RNA. Right panel. Same as just above except that increasing concentrations of STG-175 were added at the time of the electroporation. Data were calculated as log of genome equivalents (GE)/μg of total RNA and the RNA amount was normalized to a range of 0–100% in order to calculate the EC50. Results are representative of two independent experiments.

