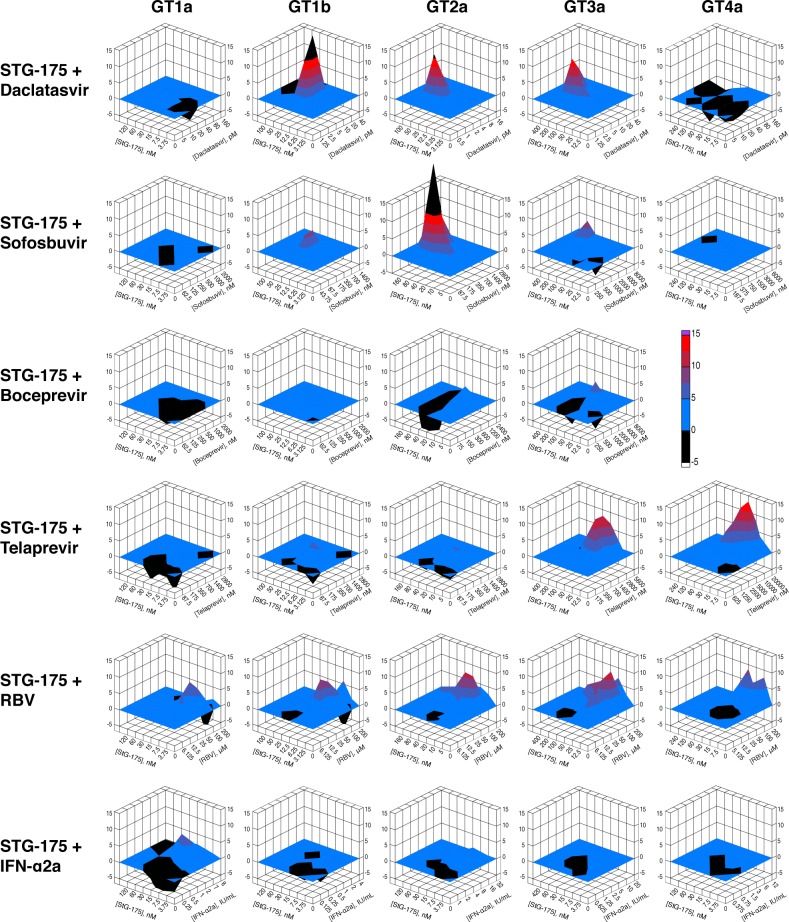
Fig 6. Drug combination analyses.
Drugs were tested in pairs in 7 concentrations around calculated EC50 in each replicon cell lines (GT1-4). Cell viability and reporter assays were carried out as we described previously [21] in 5 replicates and normalized data was used to measure the additive, synergistic and antagonistic effect between drug combinations using the mathematical model MacSynergyII. The three-dimensional response surface plot represents the differences between actual experimental effects and theoretical additive effects at various concentrations of the two selected drugs. The colors are based on a scale (-5 to +15) used to represent additive, synergistic or antagonistic effects. The plane (0%), in blue, represents an additive effect of the two drugs tested in each plot. A peak over the 0% plane indicates synergy, higher the peak, greater the synergy. A trough, on the other hand, represents antagonism. The colors used, blue to red, indicate increasing synergy with red representing a higher synergy. A synergy beyond the chosen scale is represented by black. For each plot, the data was based on the 95% confidence interval for the dose-response values using MacSynergyII. Presented results are representative of two independent experiments.

